

Question: Problem B [ 50 Marks]: Consider the following data given in Tables 1 and 2 : Answer the following questions: B-1. List all the variables
![Problem B [ 50 Marks]: Consider the following data given in](https://dsd5zvtm8ll6.cloudfront.net/si.experts.images/questions/2024/09/66f303002c03f_04766f302ff9fe14.jpg)
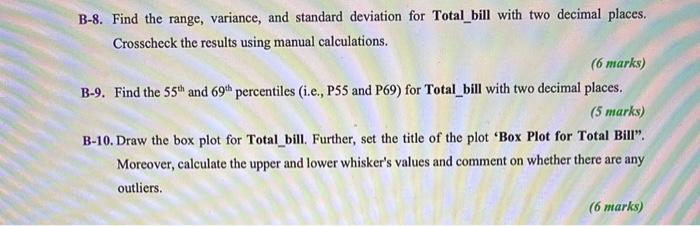
Problem B [ 50 Marks]: Consider the following data given in Tables 1 and 2 : Answer the following questions: B-1. List all the variables shown in Table 1. What is the use of Table 2's data? (Print output in two separate lines) ( 5 marks) B-2. Classify the variables in Table 1 into field types ( 5 marks) B-3. Classify the variables in Table 1 into the following terminology: Independent and dependent variables. (5 marks) B-4. Draw the histogram for Day. Name the x-axis label "Days", y-axis label "Count" and title "Histogram for Days". ( 5 marks) B-5. From the Day's histogram, on which day waiters gets most frequent tips? (2 marks) B-6. Draw the pie chart for Size. Print the data labels consisting of percentages (one decimal place) along with counts in parentheses. For example, 10.9% (12). Moreover, calculate the mode of Size? ( 6 marks) B-7. Find the mean, median, and mode for the Tip with three decimal places. Then, crosscheck the results using manual calculations. B-8. Find the range, variance, and standard deviation for Total_bill with two decimal places. Crosscheck the results using manual calculations. ( 6 marks) B-9. Find the 55th and 69th percentiles (i.e., P55 and P69) for Total_bill with two decimal places. (5 marks) B-10. Draw the box plot for Total_bill. Further, set the title of the plot 'Box Plot for Total Bill". Moreover, calculate the upper and lower whisker's values and comment on whether there are any outliers
Step by Step Solution
There are 3 Steps involved in it

Get step-by-step solutions from verified subject matter experts