

Question: . Problem Four: Using your knowledge of Excel, and the data shown below for Godzilla Sushi, as shown in class: (a) graph the following time
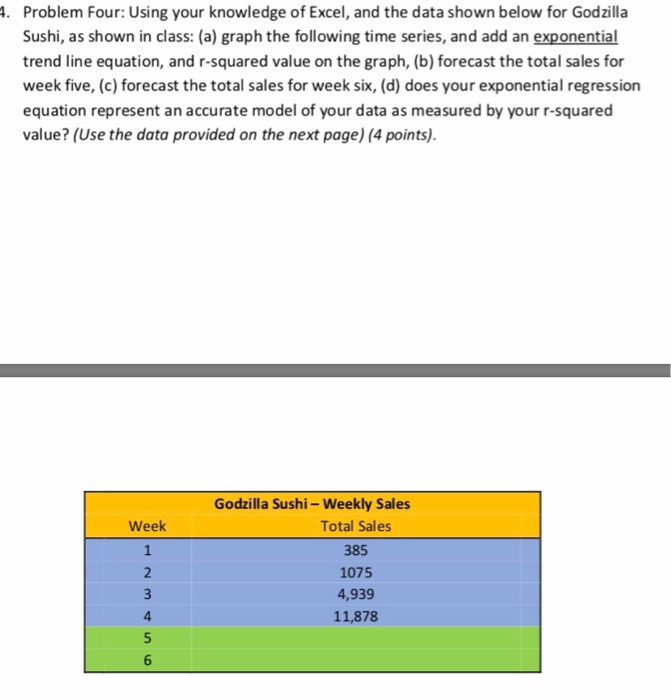
. Problem Four: Using your knowledge of Excel, and the data shown below for Godzilla Sushi, as shown in class: (a) graph the following time series, and add an exponential trend line equation, and r-squared value on the graph, (b) forecast the total sales for week five, (c) forecast the total sales for week six, (d) does your exponential regression equation represent an accurate model of your data as measured by your r-squared value? (Use the data provided on the next page) (4 points). Godzilla Sushi-Weekly Sales Week Total Sales 385 1075 4,939 11,878 4 6
Step by Step Solution
There are 3 Steps involved in it
1 Expert Approved Answer
Step: 1 Unlock

Question Has Been Solved by an Expert!
Get step-by-step solutions from verified subject matter experts
Step: 2 Unlock
Step: 3 Unlock