

Question: Problem : In this section, we describe the example system and decide what we'd like to know about its behavior and performance. Since a lot
Problem : In this section, we describe the example system and decide what we'd like to know
about its behavior and performance. Since a lot of simulation models involve waiting lines or
queues as building blocks, we'll start with a very simple case of such a model representing a
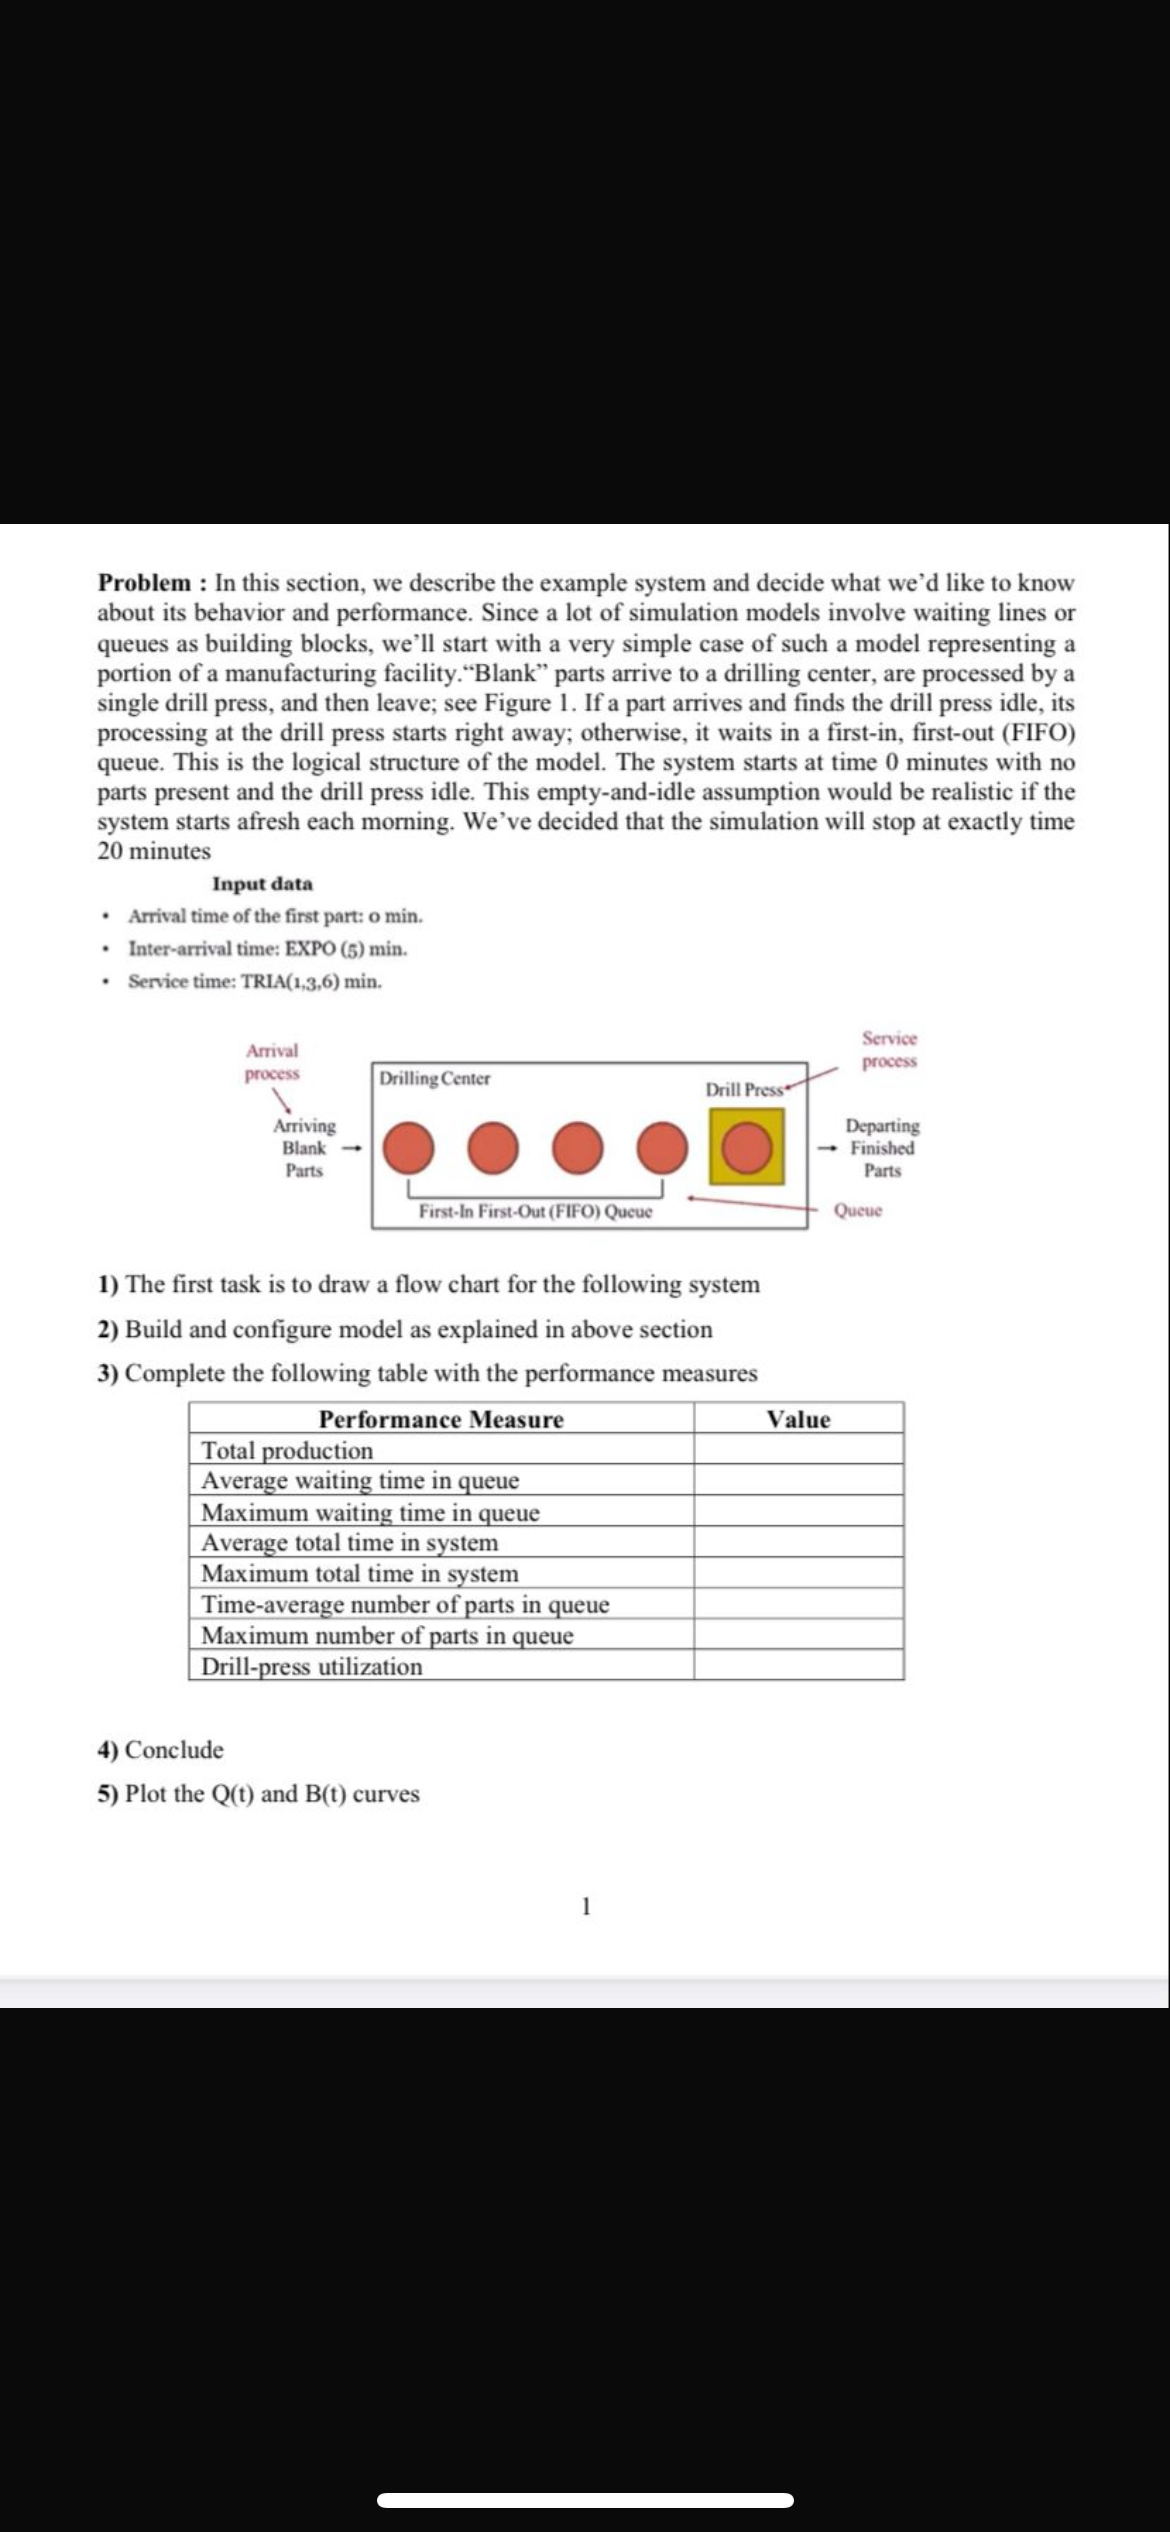
portion of a manufacturing facility."Blank" parts arrive to a drilling center, are processed by a
single drill press, and then leave; see Figure If a part arrives and finds the drill press idle, its
processing at the drill press starts right away; otherwise, it waits in a firstin firstout FIFO
queue. This is the logical structure of the model. The system starts at time minutes with no
parts present and the drill press idle. This emptyandidle assumption would be realistic if the
system starts afresh each morning. We've decided that the simulation will stop at exactly time
minutes
Input data
Arrival time of the first part: o min.
Interarrival time: EXPO min.
Service time: TRIA min.
The first task is to draw a flow chart for the following system
Build and configure model as explained in above section
Complete the following table with the performance measures
Conclude
Plot the and curves
Step by Step Solution
There are 3 Steps involved in it
1 Expert Approved Answer
Step: 1 Unlock

Question Has Been Solved by an Expert!
Get step-by-step solutions from verified subject matter experts
Step: 2 Unlock
Step: 3 Unlock