

Question: Problem is using MATLAB. Write a function called funPulseTrainPlot that plots a square-wave pulse train with inputs N=cyclesofapulsetrainT=periodofsignal(sec.)D=dutycycle(0to1)A=amplitude The plot should include 50 points per
Problem is using MATLAB.
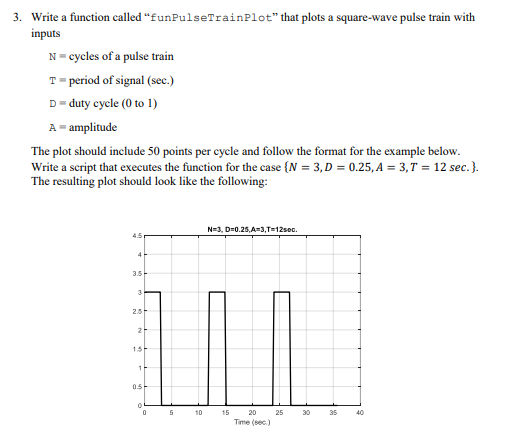
Write a function called "funPulseTrainPlot" that plots a square-wave pulse train with inputs N=cyclesofapulsetrainT=periodofsignal(sec.)D=dutycycle(0to1)A=amplitude The plot should include 50 points per cycle and follow the format for the example below. Write a script that executes the function for the case {N=3,D=0.25,A=3,T=12 sec. }. The resulting plot should look like the following
Step by Step Solution
There are 3 Steps involved in it
1 Expert Approved Answer
Step: 1 Unlock

Question Has Been Solved by an Expert!
Get step-by-step solutions from verified subject matter experts
Step: 2 Unlock
Step: 3 Unlock