

Question: Problem L 8 . 2 Approximations. When drawing straight line Bode plots we've been approximating the following system when 1 : 1 s 2 +
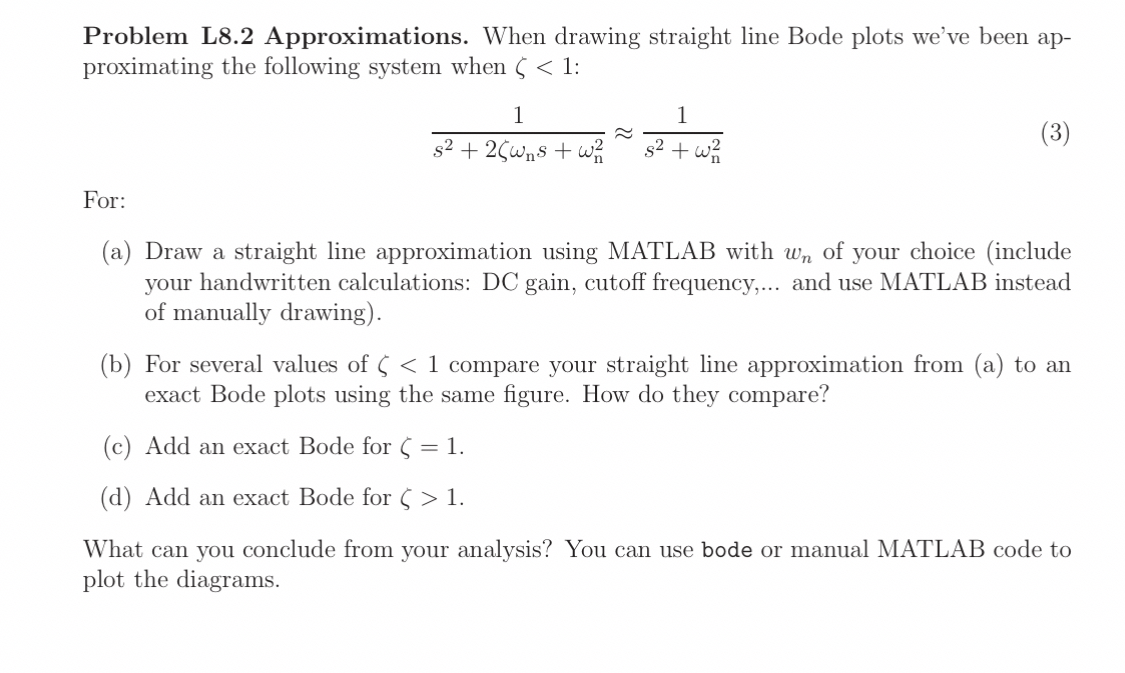
Problem L Approximations. When drawing straight line Bode plots we've been approximating the following system when :
~~
For:
a Draw a straight line approximation using MATLAB with of your choice include your handwritten calculations: DC gain, cutoff frequency,... and use MATLAB instead of manually drawing
b For several values of compare your straight line approximation from a to an exact Bode plots using the same figure. How do they compare?
c Add an exact Bode for
d Add an exact Bode for
What can you conclude from your analysis? You can use bode or manual MATLAB code to plot the diagrams. PLEASE PROVIDE MATLAB CODE FOR ALL PARTS
Step by Step Solution
There are 3 Steps involved in it
1 Expert Approved Answer
Step: 1 Unlock

Question Has Been Solved by an Expert!
Get step-by-step solutions from verified subject matter experts
Step: 2 Unlock
Step: 3 Unlock