

Question: Problem: Many companies utilize life expectancy data to calculate items such as life insurance premiums or retirement benefits. The IRS is no exception. Use
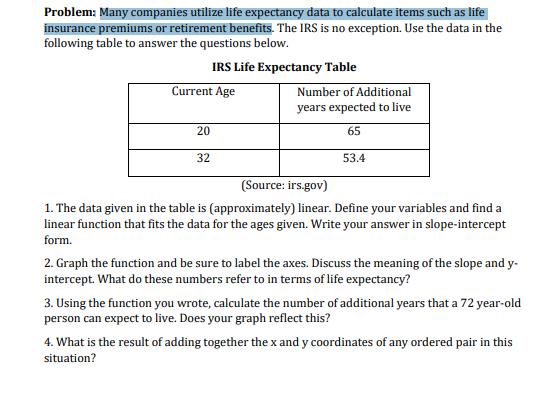
Problem: Many companies utilize life expectancy data to calculate items such as life insurance premiums or retirement benefits. The IRS is no exception. Use the data in the following table to answer the questions below. IRS Life Expectancy Table Current Age 20 32 Number of Additional years expected to live 65 53.4 (Source: irs.gov) 1. The data given in the table is (approximately) linear. Define your variables and find a linear function that fits the data for the ages given. Write your answer in slope-intercept form. 2. Graph the function and be sure to label the axes. Discuss the meaning of the slope and y- intercept. What do these numbers refer to in terms of life expectancy? 3. Using the function you wrote, calculate the number of additional years that a 72 year-old person can expect to live. Does your graph reflect this? 4. What is the result of adding together the x and y coordinates of any ordered pair in this situation?
Step by Step Solution
3.47 Rating (167 Votes )
There are 3 Steps involved in it

Get step-by-step solutions from verified subject matter experts