

Question: Problem No . 1 A student in the materials lab is trying to find out how a given aggregate gradation ( Table 1 ) compares
Problem No
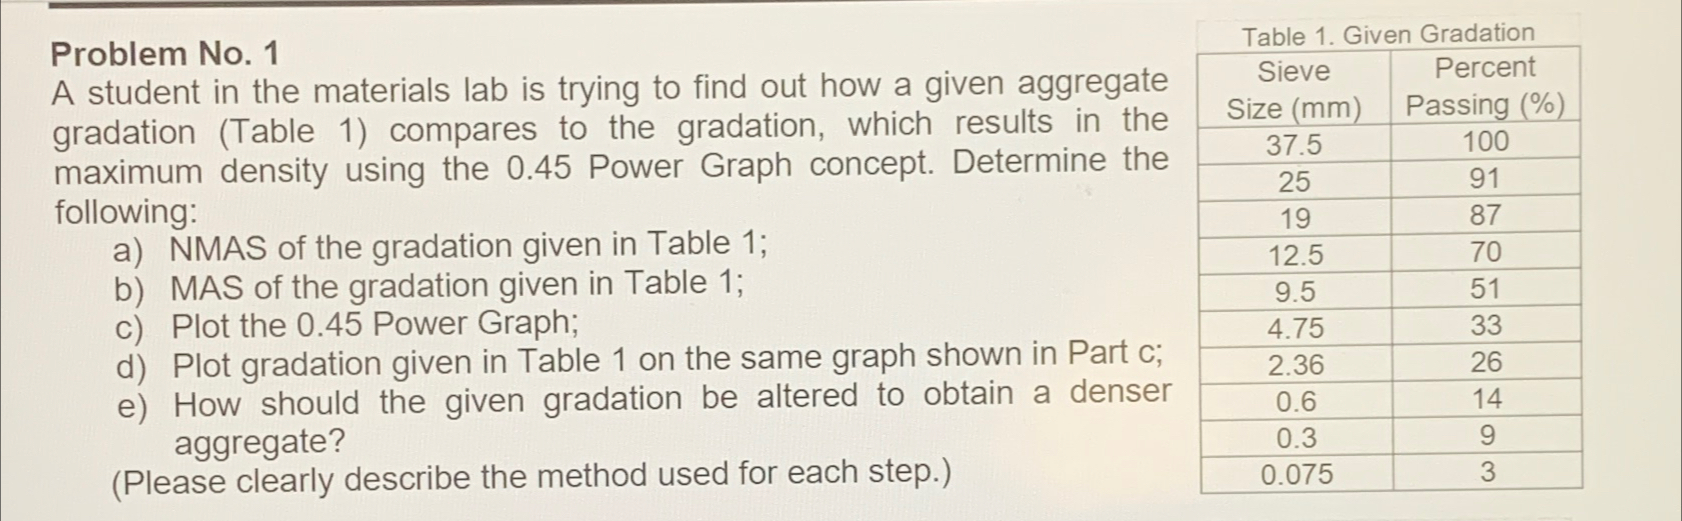
A student in the materials lab is trying to find out how a given aggregate gradation Table compares to the gradation, which results in the maximum density using the Power Graph concept. Determine the following:
a NMAS of the gradation given in Table ;
b MAS of the gradation given in Table ;
c Plot the Power Graph;
d Plot gradation given in Table on the same graph shown in Part c;
e How should the given gradation be altered to obtain a denser aggregate?
Please clearly describe the method used for each step.
tableTable Given GradationtableSieveSize
Step by Step Solution
There are 3 Steps involved in it
1 Expert Approved Answer
Step: 1 Unlock

Question Has Been Solved by an Expert!
Get step-by-step solutions from verified subject matter experts
Step: 2 Unlock
Step: 3 Unlock