Question: Problem - Please answer the following questions using the data given (show all your work) : Table 1: West Battery Data Battery life (in hours]
Problem - Please answer the following questions using the data given (show all your work)
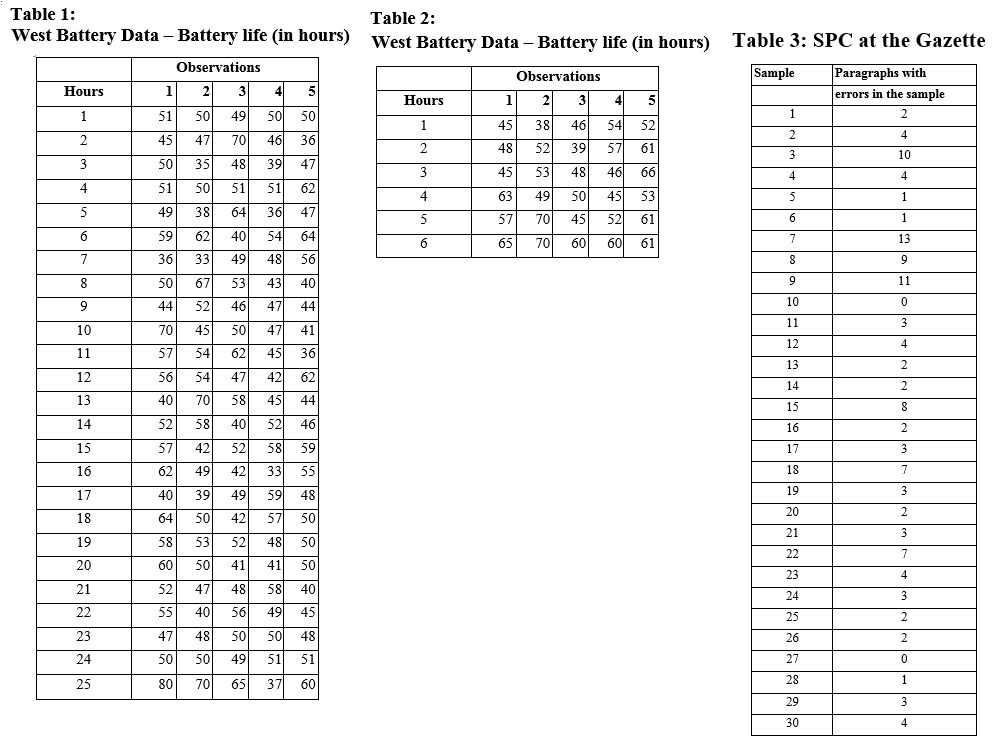
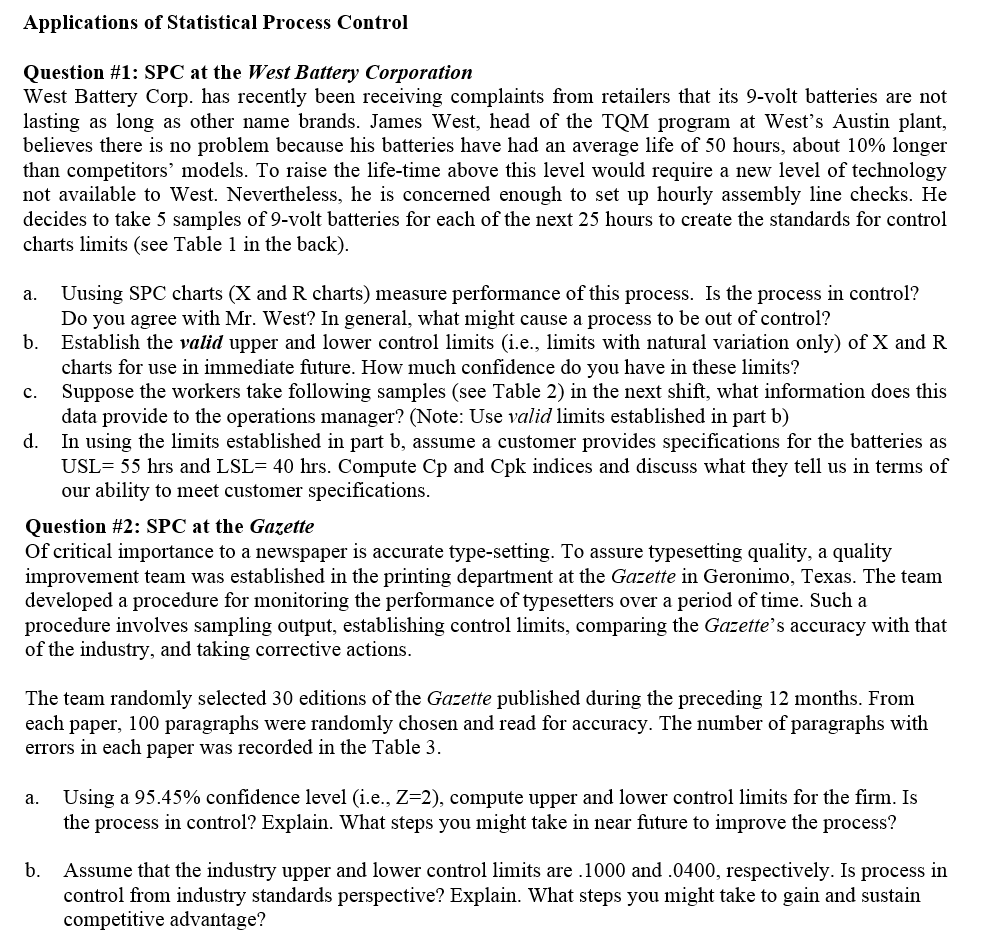
: Table 1: West Battery Data Battery life (in hours] West Battery Data _ Battery life (in hours] Observations Hours 1 2 3 4 5 1 51 49 50 5O 2 45 20 46 36 3 50 48 39 4? 4 51 51 51 62 5 49 64 36 4? 6 59 40 54 64 T 36 49 48 56 8 50 53 43 4O 9 44 46 4? 44 10 70 50 4? 41 11 52 62 45 36 12 56 42 42 62 13 40 58 45 44 14 52 40 52 46 15 5? 52 58 59 16 62 42 33 55 1? 40 49 59 48 18 64 42 52 5O 19 58 52 48 5O 20 6O 41 41 50 21 52 48 58 4O 22 55 56 49 45 23 4? 50 50 48 24 50 49 51 51 25 80 65 32 6O Table 2: Observations Hours 1 2 3 4 5 1 45 38 2 48 52 3 45 53 4 63 49 5 5? TO 6 65 m Table 3: SPC at the Gazette Sample Paragraphs with ermrs ill the sample 1 2 2 4 3 10 4 4 5 1 6 1 'I" 13 8 9 9 1 l 10 0 1 1 3 12 4 13 2 l4- 2 15 8 16 2 1? 3 18 T 19 3 20 2 21 3 22 T 23 4 24- 3 25 2 26 2 2? (J 28 1 29 3 30 4 Applications of Statistical Process Control Question #1: SPC at the WestBattery Corporation West Battery Corp. has recently been receiving complaints from retailers that its 9-volt batteries are not lasting as long as other name brands. James West, head of the TQM program at West's Austin plant, believes there is no problem because his batteries have had an average life of 50 hours, about 10% longer than competitors' models. To raise the life-time above this level would require a new level of technology not available to West. Nevertheless, he is concerned enough to set up hourly assembly line checks. He decides to take 5 samples of 9-volt batteries for each of the next 25 hours to create the standards for control charts limits (see Table l in the back). a. Uusing SPC charts (X and R charts) measure performance of this process. Is the process in control? Do you agree with Mr. West? In general, what might cause a process to be out of control? b. Establish the valid upper and lower control limits (i.e., limits with natural variation only) of X and R charts for use in immediate future. How much condence do you have in these limits? c. Suppose the workers take following samples (see Table 2) in the next shi, what information does this data provide to the operations manager? (Note: Use valid limits established in part b) d. In using the limits established in part b, assume a customer provides specications for the batteries as USL= 55 hrs and LSL= 40 hrs. Compute Cp and Cpk indices and discuss what they tell us in terms of our ability to meet customer specications. Question #2: SPC at the Gazette Of critical importance to a newspaper is accurate type-setting. To assure typesetting quality, a quality improvement team was established in the printing department at the Gazette in Geronimo, Texas. The team developed a procedure for monitoring the performance of typesetters over a period of time. Such a procedure involves sampling output, establishing control limits, comparing the Gazette's accuracy with that of the industry, and taking corrective actions. The team randomly selected 30 editions of the Gazette published during the preceding 12 months. From each paper, 100 paragraphs were randomly chosen and read for accuracy. The number of paragraphs with errors in each paper was recorded in the Table 3. a. Using a 95.45% condence level (i.e., 2:2), compute upper and lower control limits for the form. Is the process in control? Explain. 1What steps you might take in near Jture to improve the process? b. Assume that the industry upper and lower control limits are .1000 and .0400, respectively. Is process in control from industry standards perspective? Explain. What steps you might take to gain and sustain competitive advantage? Applications of Statistical Process Control Question #1: SPC at the West Battery Corporation West Battery Corp. has recently been receiving complaints from retailers that its 9-volt batteries are not lasting as long as other name brands. James West, head of the TQM program at West's Austin plant, believes there is no problem because his batteries have had an average life of 50 hours, about 10% longer than competitors' models. To raise the life-time above this level would require a new level of technology not available to West. Nevertheless, he is concerned enough to set up hourly assembly line checks. He decides to take 5 samples of 9-volt batteries for each of the next 25 hours to create the standards for control charts limits (see Table 1 in the back). a. b. c. d. Uusing SPC charts (X and R charts) measure performance of this process. Is the process in control? Do you agree with Mr. West? In general, what might cause a process to be out of control? Establish the valid upper and lower control limits (i.e., limits with natural variation only) of X and R charts for use in immediate future. How much confidence do you have in these limits? Suppose the workers take following samples (see Table 2) in the next shift, what information does this data provide to the operations manager? (Note: Use valid limits established in part b) In using the limits established in part b, assume a customer provides specifications for the batteries as USL= 55 hrs and LSL= 40 hrs. Compute Cp and Cpk indices and discuss what they tell us in terms of our ability to meet customer specifications. Question #2: SPC at the Gazette Of critical importance to a newspaper is accurate type-setting. To assure typesetting quality, a quality improvement team was established in the printing department at the Gazette in Geronimo, Texas. The team developed a procedure for monitoring the performance of typesetters over a period of time. Such a procedure involves sampling output, establishing control limits, comparing the Gazette's accuracy with that of the industry, and taking corrective actions. The team randomly selected 30 editions of the Gazette published during the preceding 12 months. From each paper, 100 paragraphs were randomly chosen and read for accuracy. The number of paragraphs with errors in each paper was recorded in the Table 3. a. Using a 95.45% confidence level (i.e., Z=2), compute upper and lower control limits for the firm. Is the process in control? Explain. What steps you might take in near future to improve the process? b. Assume that the industry upper and lower control limits are .1000 and .0400, respectively. Is process in control from industry standards perspective? Explain. What steps you might take to gain and sustain competitive advantage? Table 1: West Battery Data - Battery life (in hours) Observations Hours 1 2 3 4 5 1 51 50 49 50 50 2 45 47 70 46 36 3 50 35 48 39 47 4 51 50 51 51 62 5 49 38 64 36 47 6 59 62 40 54 64 7 36 33 49 48 56 8 50 67 53 43 40 9 44 52 46 47 44 10 70 45 50 47 41 11 57 54 62 45 36 12 56 54 47 42 62 13 40 70 58 45 44 14 52 58 40 52 46 15 57 42 52 58 59 16 62 49 42 33 55 17 40 39 49 59 48 18 64 50 42 57 50 19 58 53 52 48 50 20 60 50 41 41 50 21 52 47 48 58 40 22 55 40 56 49 45 23 47 48 50 50 48 24 50 50 49 51 51 25 80 70 65 37 60 Table 2: West Battery Data - Battery life (in hours) Observations Hours 1 2 3 4 5 1 2 45 48 38 52 46 39 54 57 52 61 3 45 53 48 46 66 4 63 49 50 45 53 5 57 70 45 52 61 6 65 70 60 60 61 Table 3: SPC at the Gazette Sample Paragraphs with errors in the sample 1 2 2 4 3 10 4 4 5 1 6 1 7 13 8 9 9 11 10 0 11 3 12 4 13 2 14 2 15 8 16 2 17 3 18 7 19 3 20 2 21 3 22 7 23 4 24 3 25 2 26 2 27 0 28 1 29 3 30 4