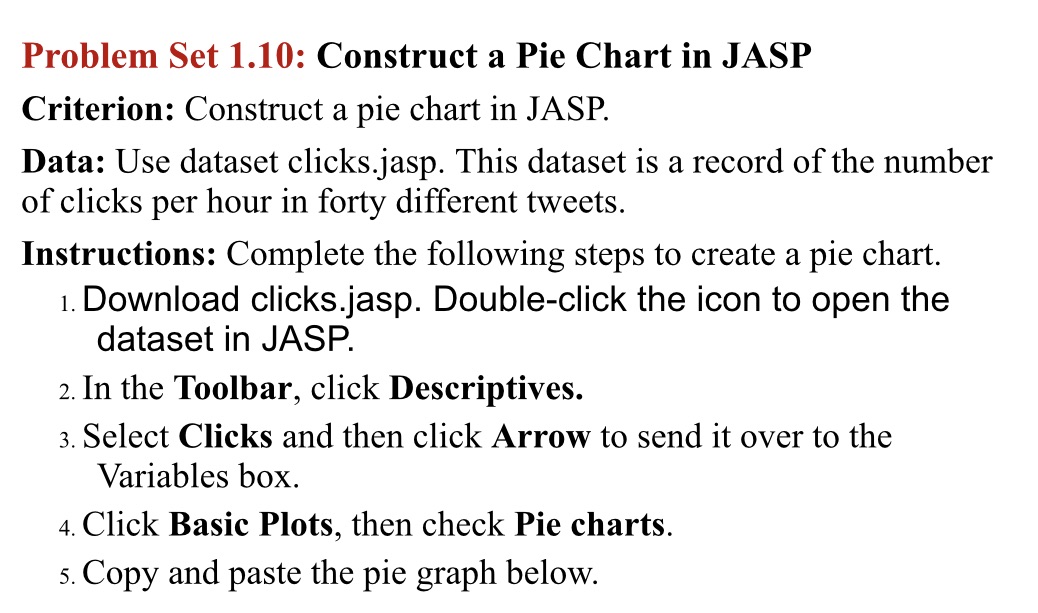
Question: Problem Set 1.10: Construct a Pie Chart in JASP Criterion: Construct a pie chart in JASP. Data: Use dataset clicksj asp. This dataset is a

Problem Set 1.10: Construct a Pie Chart in JASP
Problem Set 1.10: Construct a Pie Chart in JASP Criterion: Construct a pie chart in JASP. Data: Use dataset clicksj asp. This dataset is a record of the number of clicks per hour in forty different tweets. Instructions: Complete the following steps to create a pie chart. 1. Download clicksjasp. Double-click the icon to open the dataset in JASP. 2. In the Toolbar, click Descriptives. 3. Select Clicks and then click Arrow to send it over to the Variables box. 4. Click Basic Plots, then check Pie charts. 5. Copy and paste the pie graph below

Step by Step Solution

There are 3 Steps involved in it

1 Expert Approved Answer
Step: 1 Unlock blur-text-image
Question Has Been Solved by an Expert!

Get step-by-step solutions from verified subject matter experts

Step: 2 Unlock
Step: 3 Unlock

Students Have Also Explored These Related Accounting Questions!