Question: Problem Set #2: Inventory Aggregation Your friend Jane, an entrepreneur living in Boston, needs your help. Jane is considering opening an online store to sell
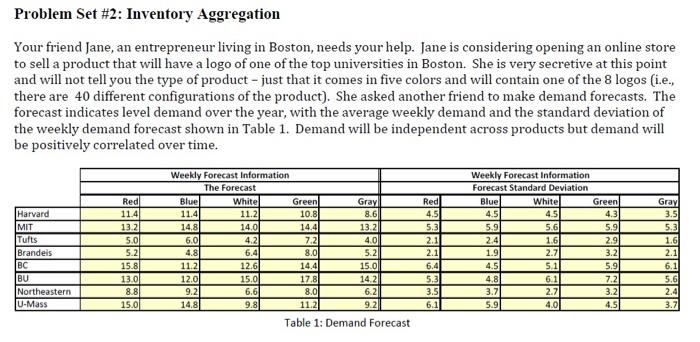
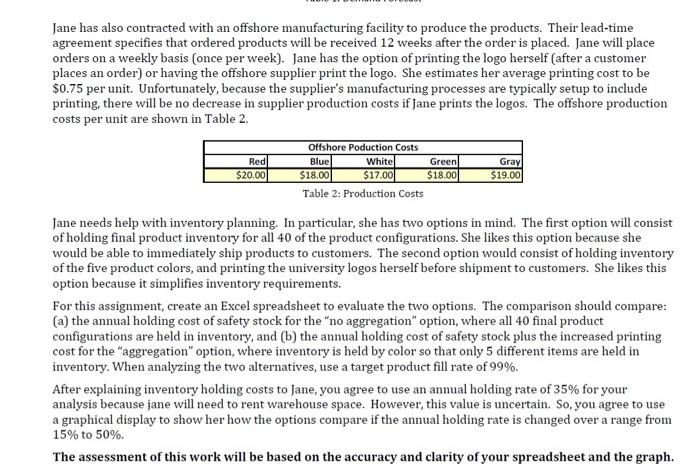
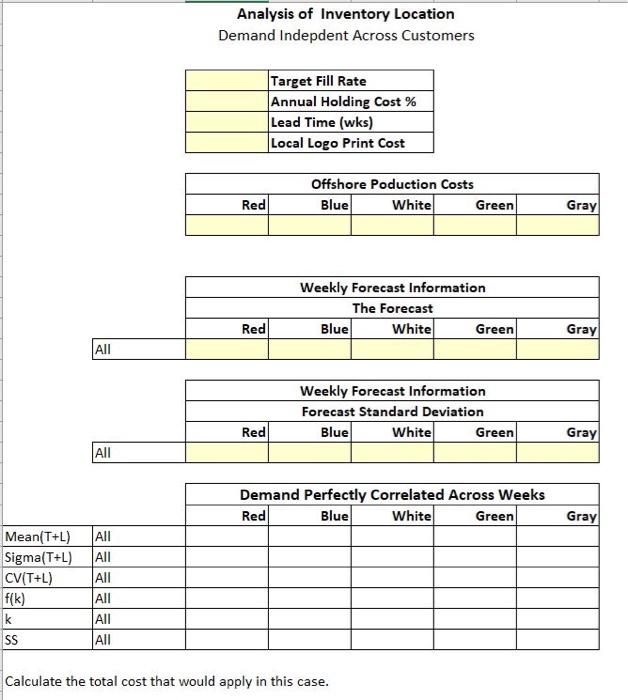
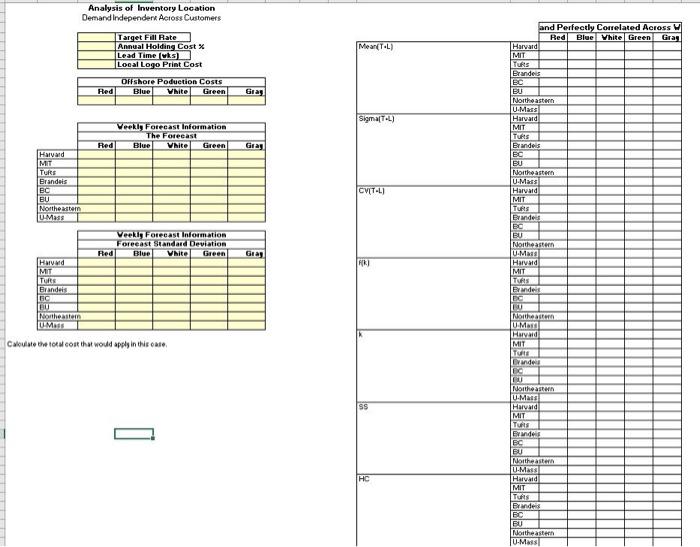
Problem Set #2: Inventory Aggregation Your friend Jane, an entrepreneur living in Boston, needs your help. Jane is considering opening an online store to sell a product that will have a logo of one of the top universities in Boston. She is very secretive at this point and will not tell you the type of product - just that it comes in five colors and will contain one of the 8 logos (i.e., there are 40 different configurations of the product). She asked another friend to make demand forecasts. The forecast indicates level demand over the year, with the average weekly demand and the standard deviation of the weekly demand forecast shown in Table 1. Demand will be independent across products but demand will be positively correlated over time. Harvard MIT Tufts Brandeis | BU Northeastern JU-Mass Red 11.4 132 5.0 5.2 15.8 13.0 8.8 15.0 Weekly Forecast Information The Forecast Blue White Green! 11.4 11.2 10.8 14,8 14.0 14.4 6.0 4.21 7.2 4.8 6.41 8.0 11.2 12.61 14.4 12.0 15.0 17.81 9.2 6.6 8.0 14.8 9.8 11.21 Gray 8.6 13.2 4.01 5.2 15.0 14.2 6.2 9.2 Red 4.5 5.3 2.1 2.1 6.4 5.3 3.5 6.1 Weekly Forecast Information Forecast Standard Deviation Blue White Green 4.5 4.5 4.3 5.9 5.6 5.9 2.4 1.6 2.9 1.9 2.7 3.2 4.51 5.1 5.9 4.8 6.1 7.2 3.7 2.7 3.2 5.9 4.0 4.5 Gray 3.5 5.3 1.6 2.1 6.11 5.6 2.4 3.7 Table 1: Demand Forecast Jane has also contracted with an offshore manufacturing facility to produce the products. Their lead-time agreement specifies that ordered products will be received 12 weeks after the order is placed. Jane will place orders on a weekly basis (once per week). Jane has the option of printing the logo herself (after a customer places an order) or having the offshore supplier print the logo. She estimates her average printing cost to be $0.75 per unit. Unfortunately, because the supplier's manufacturing processes are typically setup to include printing, there will be no decrease in supplier production costs if Jane prints the logos. The offshore production costs per unit are shown in Table 2. Red $20.00 Offshore Poduction Costs Blue Whitel Green $18.00 $17.00 $18.00 Table 2: Production Costs Gray $19.00 Jane needs help with inventory planning. In particular, she has two options in mind. The first option will consist of holding final product inventory for all 40 of the product configurations. She likes this option because she would be able to immediately ship products to customers. The second option would consist of holding inventory of the five product colors, and printing the university logos herself before shipment to customers. She likes this option because it simplifies inventory requirements. For this assignment, create an Excel spreadsheet to evaluate the two options. The comparison should compare: (a) the annual holding cost of safety stock for the "no aggregation" option, where all 40 final product configurations are held in inventory, and (b) the annual holding cost of safety stock plus the increased printing cost for the "aggregation" option, where inventory is held by color so that only 5 different items are held in inventory. When analyzing the two alternatives, use a target product fill rate of 99%. After explaining inventory holding costs to Jane, you agree to use an annual holding rate of 35% for your analysis because jane will need to rent warehouse space. However, this value is uncertain. So, you agree to use a graphical display to show her how the options compare if the annual holding rate is changed over a range from 15% to 50%. The assessment of this work will be based on the accuracy and clarity of your spreadsheet and the graph. Analysis of Inventory Location Demand Indepdent Across Customers Target Fill Rate Annual Holding Cost % Lead Time (wks) Local Logo Print Cost Offshore Poduction Costs Blue White Green Red Gray Weekly Forecast Information The Forecast Blue White Green Red Gray All Weekly Forecast Information Forecast Standard Deviation Blue White Green Red Gray All Demand Perfectly Correlated Across Weeks Red Blue White Green Gray All Mean(T+L) Sigma(T+L) CV(T+L) f(k) k SS All All All All All Calculate the total cost that would apply in this case. Analysis of Inventory Location Demand Independent Across Customers MeantToL) Target Fl Rate Annual Holding Cost Lead Time (ks) Local Logo Print Cost Offshore Poduction Costs Red Blue White Green Glas SigmaTAL) Veekly Forecast Information The Forecast Red Blue White Green and Perfectly Correlated Across W Bed Blue White Green Gray Harvard MIT TURES Terdes EC BU Northeastern U.ME Harvard MIT TURS Brandeis BU Northeastern U.Mas Harvard MIT TURS Branded EC Gray Harvard MT TURE Brandeis BC BU Northeastern U Mass CVIT-L] Veekig Forecast Information Forecast Standard Deviation Blue VNITO Green Red FK Hard MT TURES Brandeis Northeastern U.Mais Harvard MIT TU Brindes DO BU Northeastern U MOSS Calculate the total cost that would apply in the case North UMANO Havad MIT TORE Cinder! A 00 Northeastern U.Mais Harvad MIT LU Endes BC BU Northeastern U-Mass Harvard HC MIT TU Bende BC BU Northeastern U-Mass