

Question: Problem Set 4: Data Analysis to Determine Moles & Atoms A. Interpreting and Analyziog Dahi froma Graph (Pie Chart): The key for the ple chart
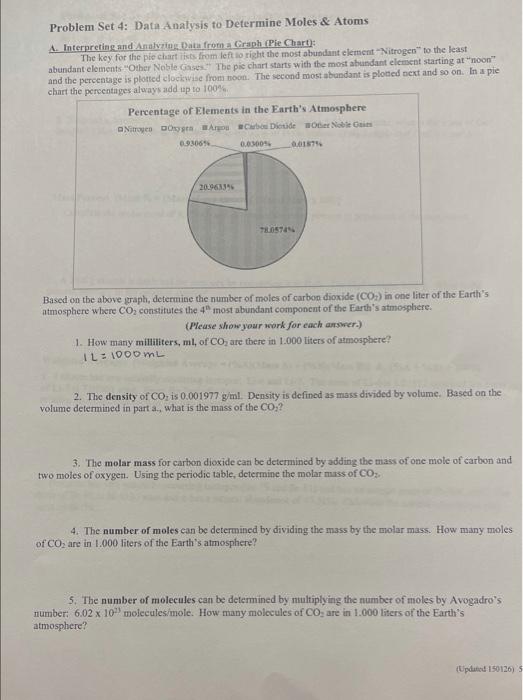
Problem Set 4: Data Analysis to Determine Moles \& Atoms A. Interpreting and Analyziog Dahi froma Graph (Pie Chart): The key for the ple chart issos firom left 10 right the most abundant element "Nitrogen" to the least abundant elements "Other Noble Gases"" The pic chart starts with the most abundant element starting at "noon" and the pereenage is plotred clociswize from toon. The second most abundant is ploted next and s0 on. In a pie chart the ocencentages always add up to 100% s. Based on the above graph, determine the number of moles of carbon dioxide (CO2) in one liter of the Earth's atmosphere where CO2 constitutes the 4n most abundant component of the Earth's atmosphere. (Please show your work for each answer.) 1. How many milliliters, ml, of CO2 are there in 1.000 liters of amosphere? 1L=1000mL 2. The density of CO2, is 0.001977g/ml. Density is defined as mass divided by volume. Based on the volume determined in part a., what is the mass of the CO2 ? 3. The molar mass for carbon diexide cati be determined by adding the mass of one mole of carbon and two moles of oxyger. Using the periodic table, determine the molar muss of CO3. 4. The number of moles ean be determined by dividing the mass by the molar mass. How many moles of CO2 are in 1.000 liters of the Earth's atmosphere? 5. The number of molecules can be determined by nultiplying the number of moles by Avogadro's number: 6.021033 moleculesimole. How many molecules of CO2 are in 1.000 liters of the Earth's atmosphere
Step by Step Solution
There are 3 Steps involved in it

Get step-by-step solutions from verified subject matter experts