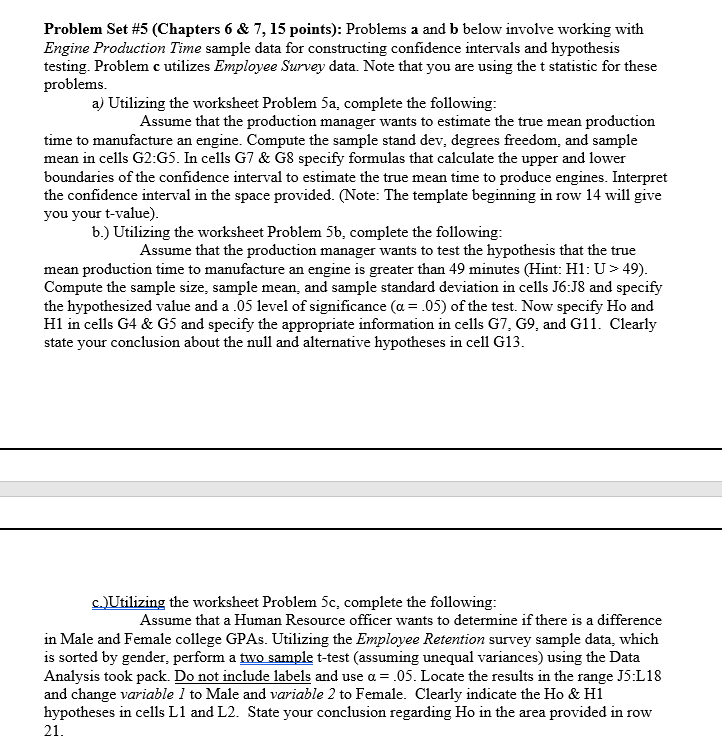
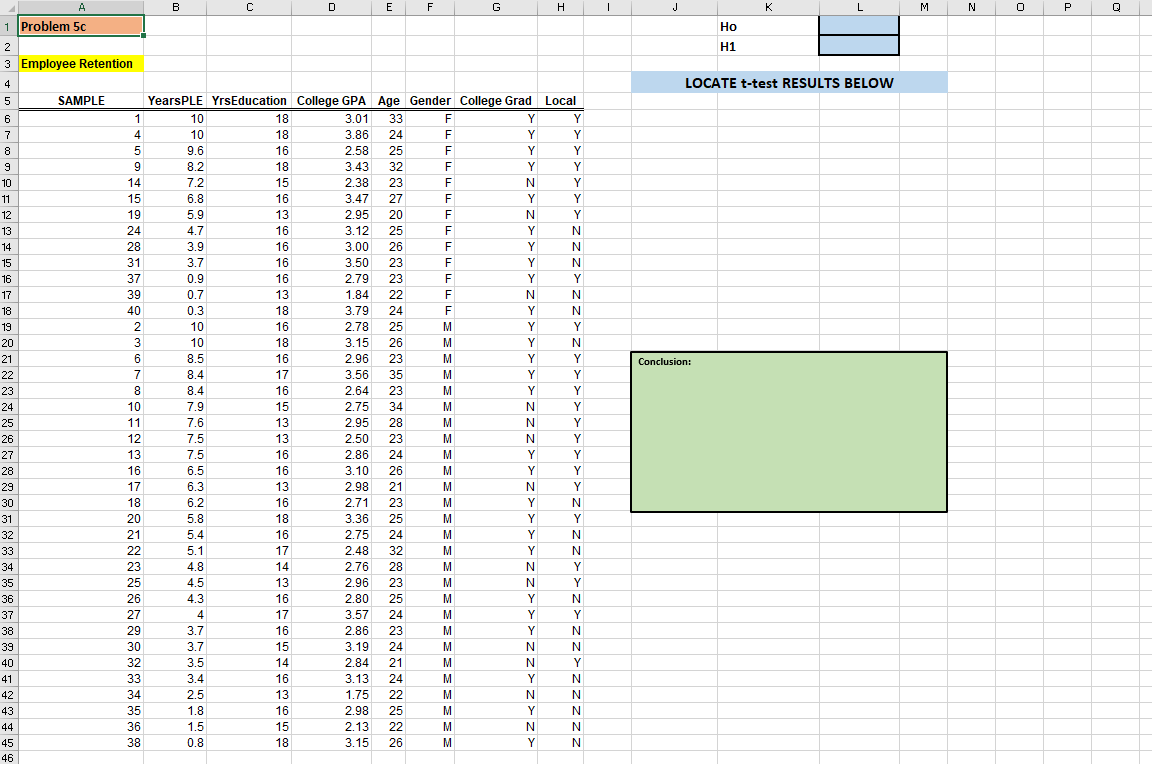
Question: Problem Set #5 (Chapters 6 & 7, 15 points): Problems a and b below involve working with Engine Production Time sample data for constructing confidence

Problem Set #5 (Chapters 6 & 7, 15 points):Problem Set #5 (Chapters 6 & 7, 15 points):

Problem Set #5 (Chapters 6 & 7, 15 points): Problems a and b below involve working with Engine Production Time sample data for constructing confidence intervals and hypothesis testing. Problem c utilizes Employee Survey data. Note that you are using the t statistic for these problems. a) Utilizing the worksheet Problem 5a, complete the following: Assume that the production manager wants to estimate the true mean production time to manufacture an engine. Compute the sample stand dev, degrees freedom, and sample mean in cells G2:G5. In cells G7 & G8 specify formulas that calculate the upper and lower boundaries of the confidence interval to estimate the true mean time to produce engines. Interpret the confidence interval in the space provided. (Note: The template beginning in row 14 will give you your t-value). b.) Utilizing the worksheet Problem 5b, complete the following: Assume that the production manager wants to test the hypothesis that the true mean production time to manufacture an engine is greater than 49 minutes (Hint: H1: U>49). Compute the sample size, sample mean and sample standard deviation in cells J6:58 and specify the hypothesized value and a .05 level of significance (a = .05) of the test. Now specify Ho and H1 in cells G4 & G5 and specify the appropriate information in cells G7, 69, and G11. Clearly state your conclusion about the null and alternative hypotheses in cell G13. c. Utilizing the worksheet Problem 5c, complete the following: Assume that a Human Resource officer wants to determine if there is a difference in Male and Female college GPAs. Utilizing the Employee Retention survey sample data, which is sorted by gender, perform a two sample t-test (assuming unequal variances) using the Data Analysis took pack. Do not include labels and use a = .05. Locate the results in the range J5:118 and change variable 1 to Male and variable 2 to Female. Clearly indicate the Ho & H1 hypotheses in cells L1 and L2. State your conclusion regarding Ho in the area provided in row 21. 1 J K M N N O P Q Ho H1 LOCATE t-test RESULTS BELOW 26 40 vOWN Conclusion: A B E F G H 1 Problem 5c 2 3 Employee Retention 4 5 SAMPLE YearsPLE YrsEducation College GPA Age Gender College Grad Local 6 1 10 18 3.01 33 F Y Y 7 7 4 10 18 3.86 24 F Y Y 8 5 9.6 16 2.58 25 F Y Y 9 9 8.2 18 3.43 32 F Y Y 10 14 7.2 15 2.38 23 F N Y 11 15 6.8 16 3.47 27 F Y Y 12 19 5.9 13 2.95 ve 20 F N Y 2:20 13 24 4.7 16 3.12 27 25 F Y N 2.1 14 28 3.9 16 3.00 F Y N 2.00 . 15 31 3.7 16 10 3.50 23 F Y N die 16 37 0.9 16 " 2.79 23 F Y Y 2.1 17 39 0.7 13 1.84 22 F N N 18 0.3 18 24 3.79 F Y " N JS 19 2 10 16 2.78 25 M Y Y 2.1 20 3 10 18 3.15 26 M Y N 12 21 6 8.5 16 2.96 23 M Y Y 22 7 8.4 17 3.56 35 M Y Y . 23 8 8.4 16 2.64 M Y Y 24 10 7.9 15 2.75 34 M N Y 21 25 11 7.6 13 20 2.95 28 M N Y 26 12 7.5 13 20 2.50 23 M N Y 27 13 7.5 16 2.86 24 M Y Y 40 28 16 6.5 16 3.10 26 M Y Y 47 29 17 6.3 13 200 2.98 21 M M N Y 10 de 30 18 6.2 16 2.71 23 M Y N 40 31 20 5.8 18 3.36 25 M M Y Y de 32 21 5.4 M 16 2.75 24 M Y N 24 33 22 M 5.1 17 2.48 32 M Y N w za 34 23 4.8 14 2.76 28 M N Y er 35 j 25 4.5 13 2.96 23 M M N Y de wo 36 26 4.3 16 2.80 25 M Y N 2 27 37 4 17 3.57 24 M Y Y 20 10 38 29 3.7 16 2.86 23 M Y N s 0 2 40 39 30 3.7 15 3.19 M N 10 N 20 25 40 201 24 v 3.5 14 2.84 21 M N Y se 240 41 33 3.4 16 3.13 24 M Y N 24 42 425 34 2.5 13 1.75 22 M N N 43 35 1.8 16 2.98 25 M Y N 24 44 1.5 15 2.13 22 M N N 45 38 0.8 18 3.15 M Y N 46 23 24 32 36 26

Step by Step Solution

There are 3 Steps involved in it

1 Expert Approved Answer
Step: 1 Unlock blur-text-image
Question Has Been Solved by an Expert!

Get step-by-step solutions from verified subject matter experts

Step: 2 Unlock
Step: 3 Unlock

Students Have Also Explored These Related General Management Questions!