

Question: Problem Set 5: Productivity and Costs Due Date on Classroom 1 Productivity [6 pts] The following table shows the number of lawns a company can
![Productivity [6 pts] The following table shows the number of lawns a](https://s3.amazonaws.com/si.experts.images/answers/2024/06/667c25eea6c72_206667c25ee7d0ba.jpg)
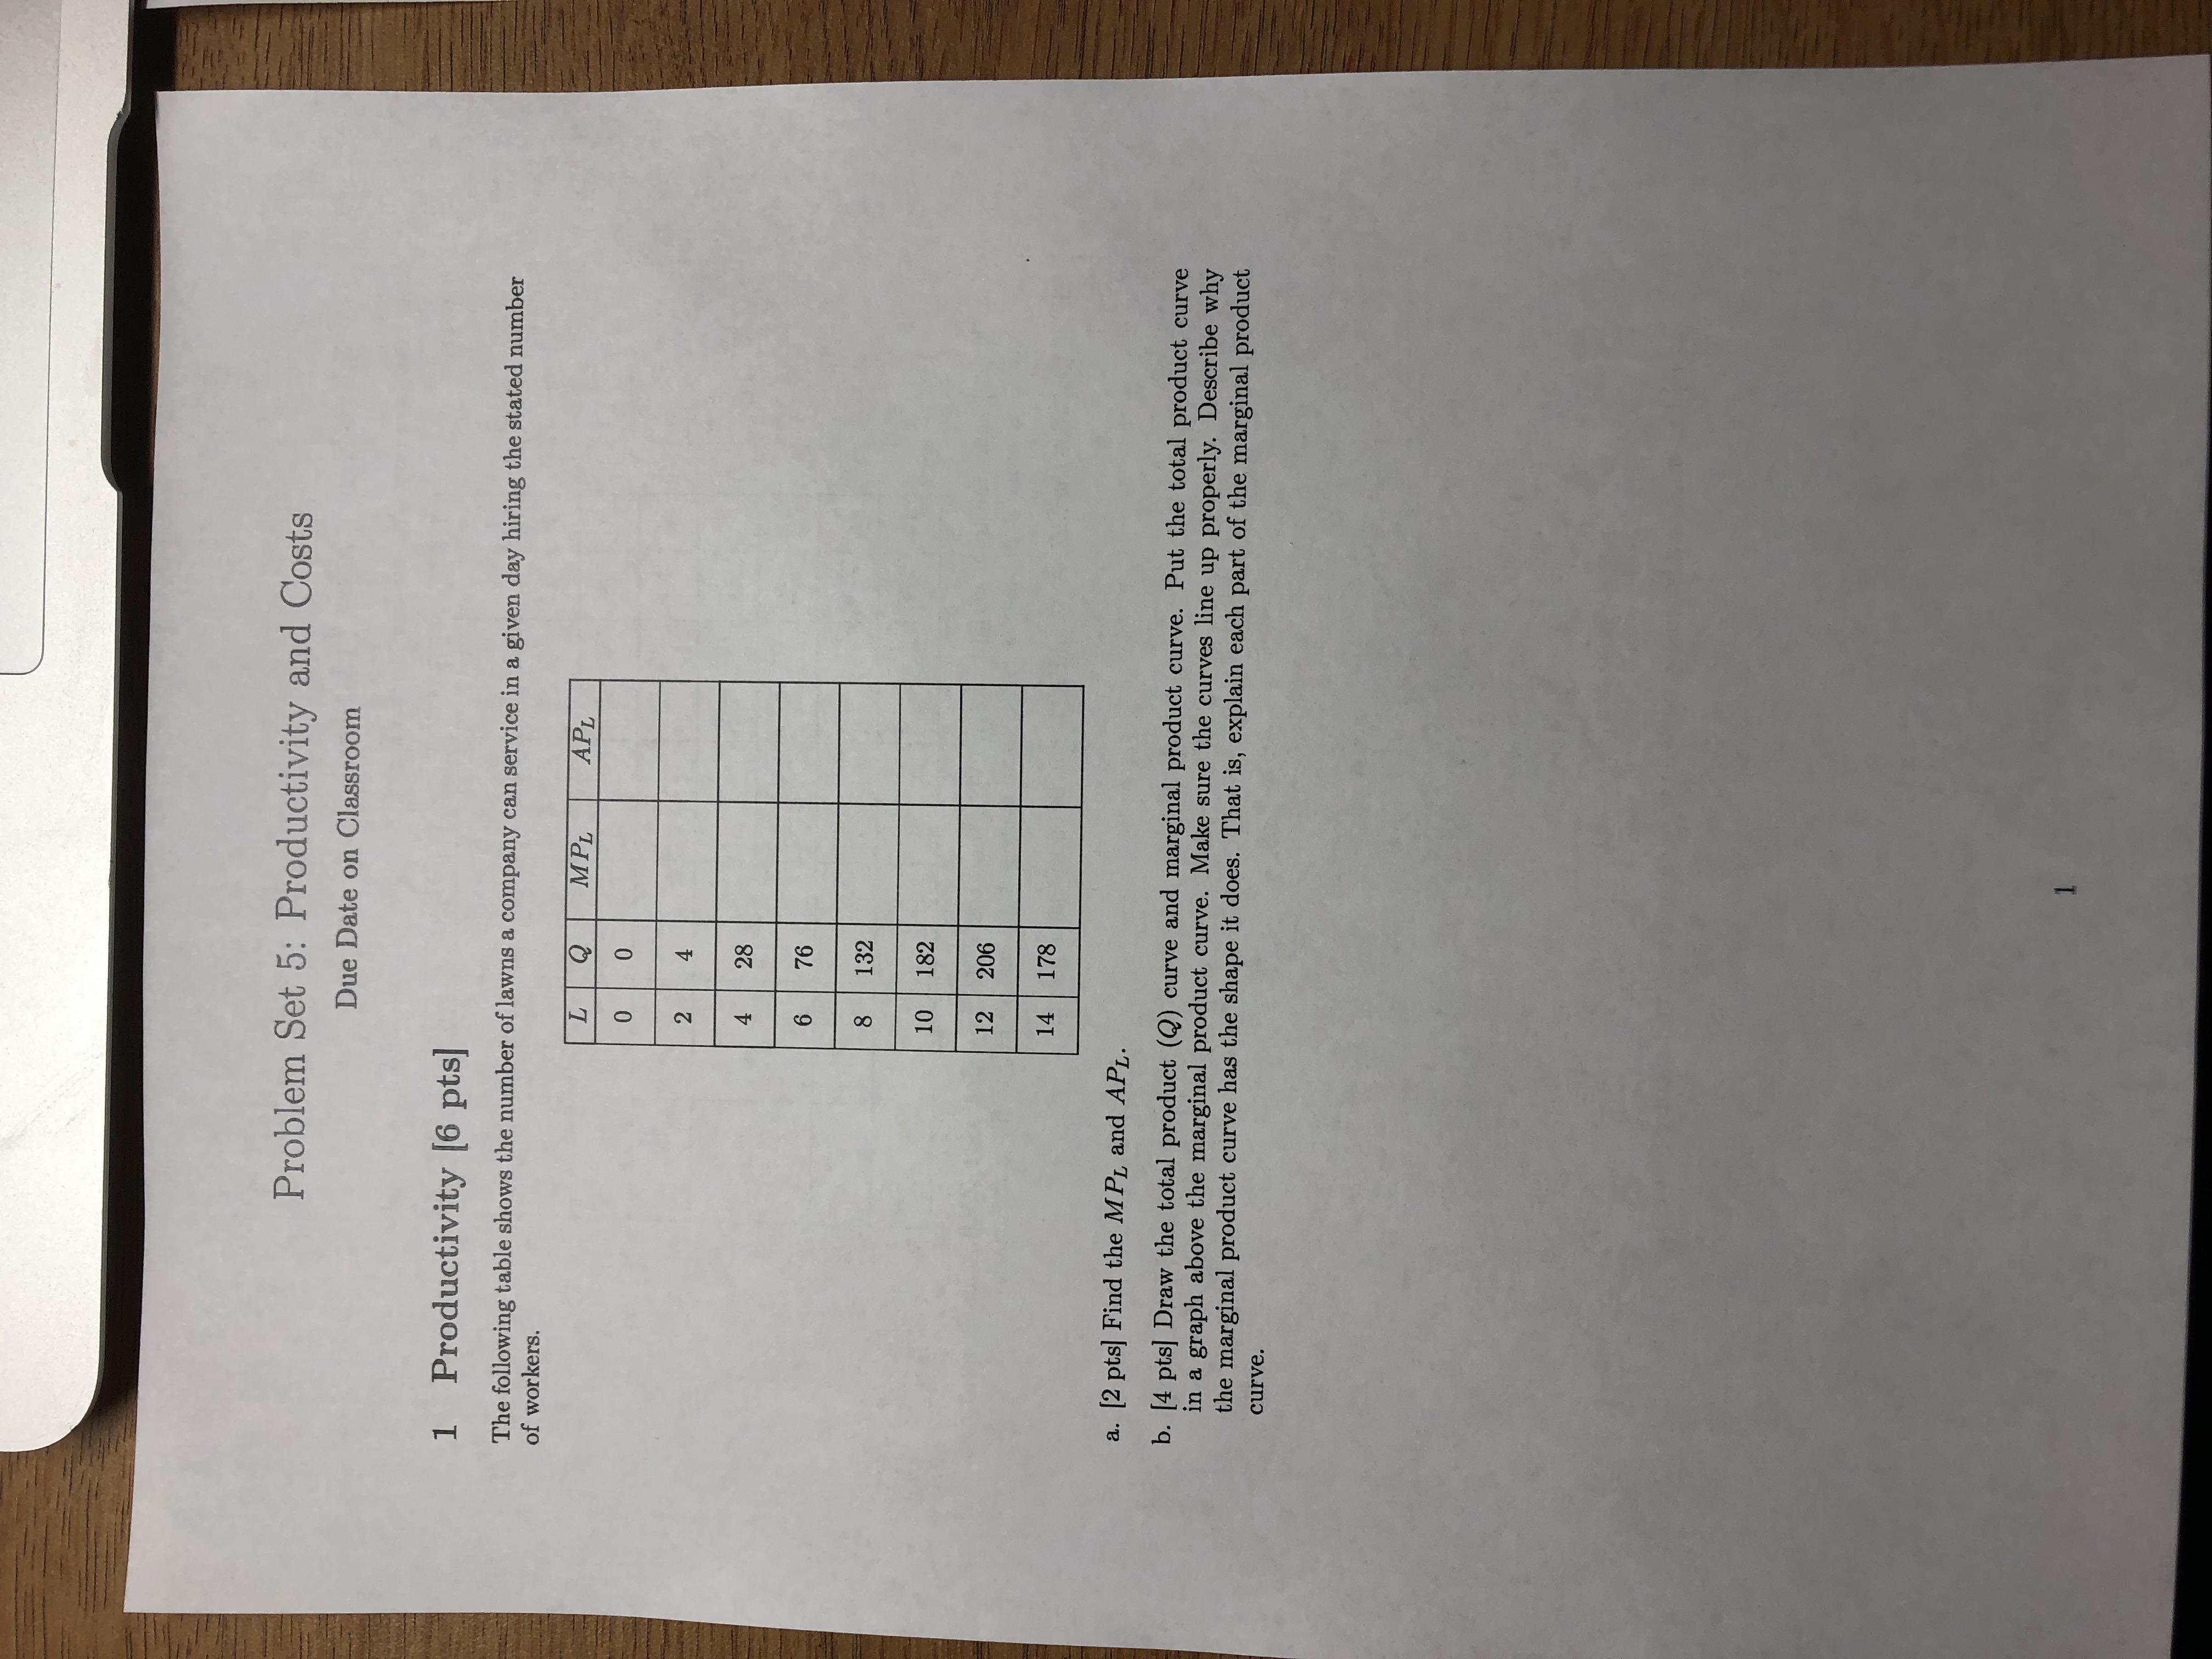
Problem Set 5: Productivity and Costs Due Date on Classroom 1 Productivity [6 pts] The following table shows the number of lawns a company can service in a given day hiring the stated number of workers. L Q MP L APL 10 0 2 4 4 28 76 8 132 10 182 12 206 14 178 a. [2 pts] Find the MPL and APL. b. [4 pts] Draw the total product (Q) curve and marginal product curve. Put the total product curve in a graph above the marginal product curve. Make sure the curves line up properly. Describe why the marginal product curve has the shape it does. That is, explain each part of the marginal product curve
Step by Step Solution
There are 3 Steps involved in it
1 Expert Approved Answer
Step: 1 Unlock

Question Has Been Solved by an Expert!
Get step-by-step solutions from verified subject matter experts
Step: 2 Unlock
Step: 3 Unlock