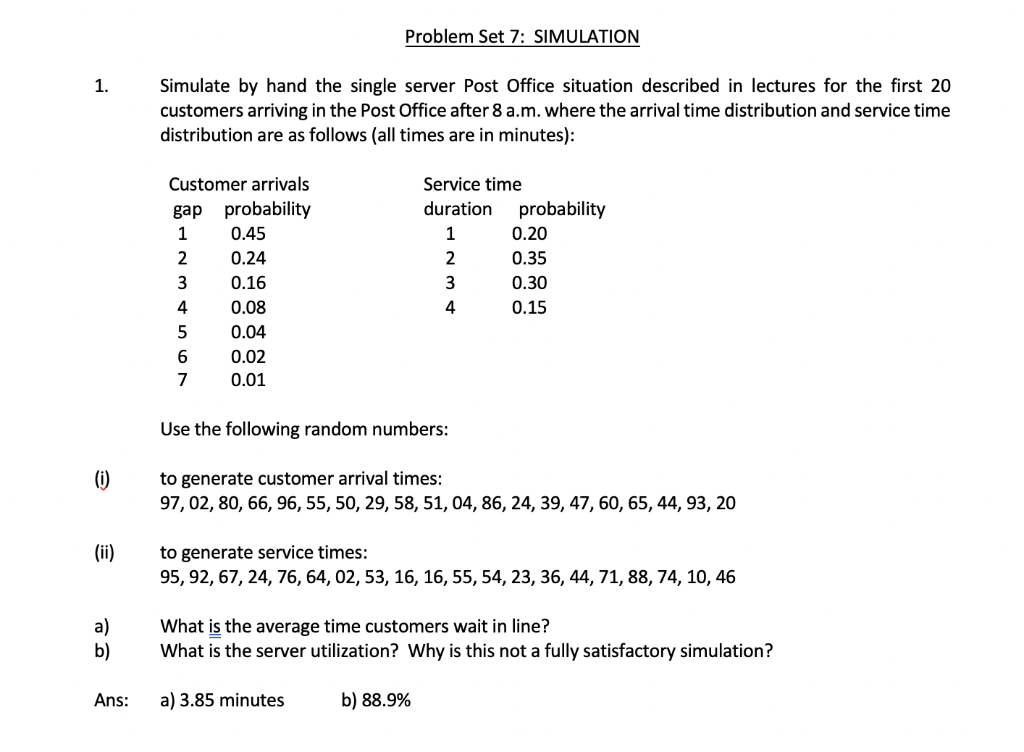
Question: Problem Set 7: SIMULATION 1. Simulate by hand the single server Post Office situation described in lectures for the first 20 customers arriving in the

Problem Set 7: SIMULATION 1. Simulate by hand the

Problem Set 7: SIMULATION 1. Simulate by hand the single server Post Office situation described in lectures for the first 20 customers arriving in the Post Office after 8 a.m. where the arrival time distribution and service time distribution are as follows (all times are in minutes): Customer arrivals gap probability 0.45 0.24 0.16 4 0.08 0.04 0.02 0.01 Service time duration probability 0.20 0.35 0.30 0.15 WN HNM Use the following random numbers: to generate customer arrival times: 97, 02, 80, 66, 96, 55, 50, 29, 58, 51, 04, 86, 24, 39, 47, 60, 65, 44, 93, 20 to generate service times: 95, 92, 67, 24, 76, 64, 02, 53, 16, 16, 55, 54, 23, 36, 44, 71, 88, 74, 10, 46 What is the average time customers wait in line? What is the server utilization? Why is this not a fully satisfactory simulation? Ans: a) 3.85 minutes b) 88.9%

Step by Step Solution

There are 3 Steps involved in it

1 Expert Approved Answer
Step: 1 Unlock blur-text-image
Question Has Been Solved by an Expert!

Get step-by-step solutions from verified subject matter experts

Step: 2 Unlock
Step: 3 Unlock

Students Have Also Explored These Related General Management Questions!