Question: Problem Statement A regional airline is concerned about its record of on-time performance. The Memphis hub experiences 20 flight operations each day of the week,
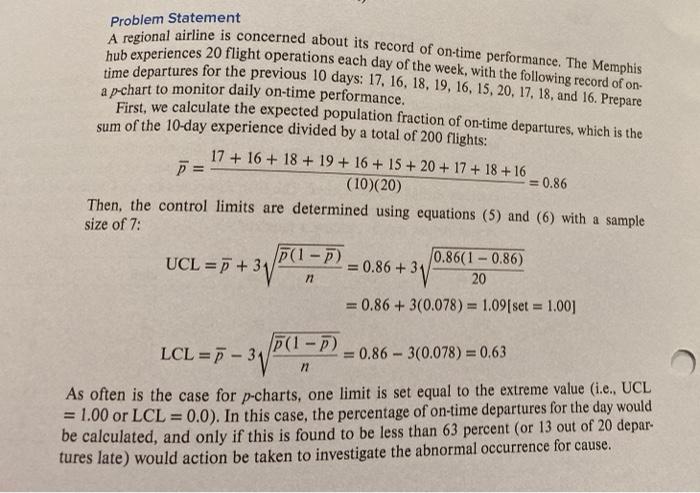
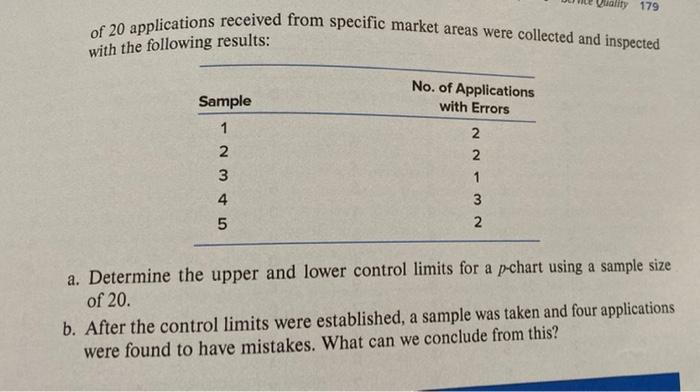
Problem Statement A regional airline is concerned about its record of on-time performance. The Memphis hub experiences 20 flight operations each day of the week, with the following record of on- time departures for the previous 10 days: 17, 16, 18, 19, 16, 15, 20, 17, 18, and 16. Prepare a p-chart to monitor daily on-time performance, First, we calculate the expected population fraction of on-time departures, which is the sum of the 10-day experience divided by a total of 200 flights: 17 + 16 + 18 + 19 + 16 + 15 + 20+ 17 + 18 + 16 P = = 0.86 (10)(20) Then, the control limits are determined using equations (5) and (6) with a sample size of 7: P(1-P) 0.86(1 - 0.86) UCL = 5 +3V = 0.86 +31 20 = 0.86 +3(0.078) = 1.09[set = 1.00] n P(1-P) -31 = 0.86 - 3(0.078) = 0.63 n As often is the case for p-charts, one limit is set equal to the extreme value (i.e., UCL = 1.00 or LCL = 0.0). In this case, the percentage of on-time departures for the day would be calculated, and only if this is found to be less than 63 percent (or 13 out of 20 depar tures late) would action be taken to investigate the abnormal occurrence for cause. 6.8. The Long Life Insurance Company receives applications to buy insurance from its salespeople, who are specially trained in selling insurance to new customers. After the applications are received, they are processed through a computer. The computer is programmed so that it prints messages whenever it runs across an item that is not consistent with company policies. The company is concerned with the accuracy of the training that its salespeople receive, and it contemplates recalling them for more training if the quality of their performance is below certain limits. Five samples Vality 179 of 20 applications received from specific market areas were collected and inspected with the following results: Sample No. of Applications with Errors 1 u WN 2 2 1 3 2 4 a. Determine the upper and lower control limits for a p-chart using a sample size of 20. b. After the control limits were established, a sample was taken and four applications were found to have mistakes. What can we conclude from this