

Question: Problem The Excel file Closing Stock Prices provides data for four stocks and the Down Jones Industrial Average (DJIA) over one month. a. Develop a
Problem The Excel file Closing Stock Prices provides data for four stocks and the Down Jones Industrial Average (DJIA) over one month. a. Develop a spreadsheet model for forecasting each of the stock prices and the DJIA using a simple two-period and three-period moving average. (Do the simple two-period and three-period moving average ONLY for DJIA). b. Compute MAD, MSE, and MAPE and determine whether two or three moving average periods is better. The general procedure is outlined below. 1. Open the file Excel files for Assignment 7. In the first tab, you will find the table. 2. Compute the two-period moving average for only DJIA. In the next columns compute the MAD, MSE and MAPE. 3. Copy the DJIA in another place of the spreadsheet. Compute the three-period moving average. In the next columns compute the MAD, MSE and MAPE.
The Excel file Closing Stock Prices provides data for four stocks and the down Jones industrial average over one month. a. Develop a spreadsheet model for forecasting each of the stock prices using simple exponential smoothing with the smoothing constant of 0.3. (Do the simple exponential smoothing ONLY for DJIA) b. (do not do part b) c. Compute MAD, MSE, and MAPE. d. Does a smoothing constant of 0.1 or 0.5 yield better results? The general procedure is outlined below. 1. Open the file Excel files for Assignment 7. In the first tab, you will find the table. 2. Compute the simple exponential smoothing with smoothing constant of 0.3 for only DJIA. In the next columns compute the MAD, MSE and MAPE. 3. Compute the simple exponential smoothing with smoothing constant of 0.1 for only
2 DJIA. In the next columns compute the MAD, MSE and MAPE 4. Compute the simple exponential smoothing with smoothing constant of 0.5 for only DJIA. In the next columns compute the MAD, MSE and MAPE 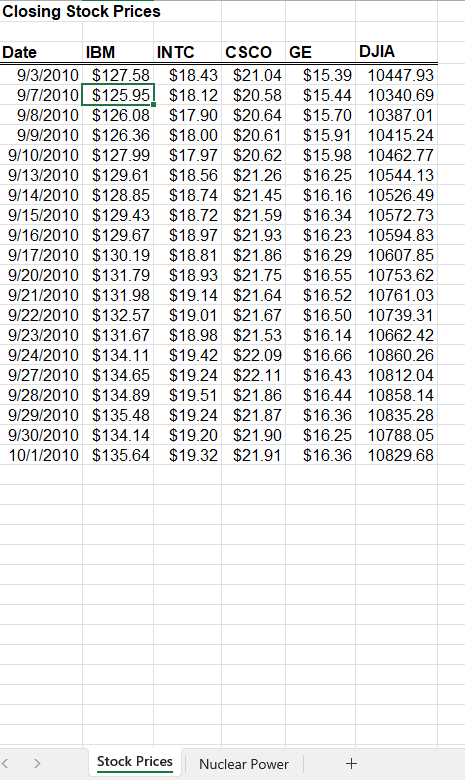
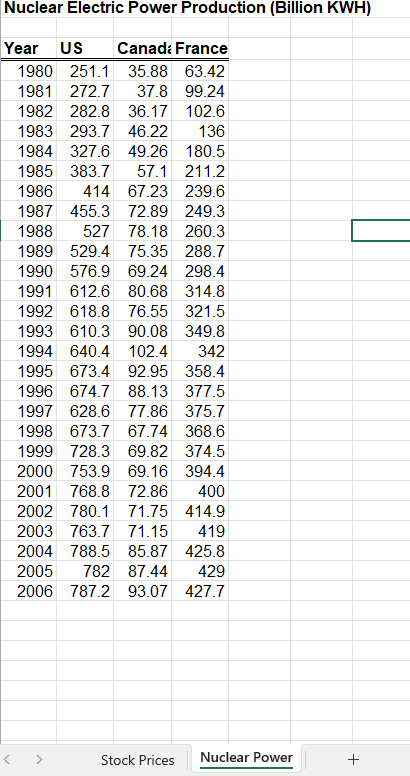
Consider the data in the Excel file Nuclear Power. Use simple linear regression to forecast the data what would be the forecast for the next three years? (Do the forecast only for US) The general procedure is outlined below. 1. Open the file Excel files for Assignment 5. In the second tab, you will find the table. 2. Use Data > Data Analysis > Regression. For the Input Y range, put US including the label. For the Input X range, put the range of Year including the label. Click on the label box. Select an output range. Copy the slope and intercept from the regression model using the coefficients in the Excel Output. 3. Add a column for computing the US forecast. The US trend forecast would be the intercept plus slope times the year. 4. Add three years in column A. Forecast the US trend using the regression. (intercept plus slope times the year.) 5. Answer the questions included in the submission link.
Closing Stock Prices \begin{tabular}{|c|c|c|c|c|c|} \hline te & IBM & JTC & SCO & GE & JIA \\ \hline 9/3/2010 & $127.58 & $18.43 & $21.04 & $15.39 & 10447. \\ \hline 9/7/2010 & $125.95 & $18.12 & 0.58 & 5.44 & 10340. \\ \hline 9/8/2010 & $126.08 & $17.90 & 0.64 & 5.70 & 8701 \\ \hline & $126.36 & & & & \\ \hline 0 & & & & & \\ \hline & 51 & & & 6.25 & \\ \hline & $12 & $ & $ & 16 & 10 \\ \hline & & & & & 1 \\ \hline & $12 & & & & \\ \hline & & & & & \\ \hline & & & & & \\ \hline & & & & & 1.03 \\ \hline 9/2 & & & & & 9.31 \\ \hline 9/23 & 67 & 98 & 53 & 14 & 2.42 \\ \hline 9/2 & 11 & $ & & & 0.26 \\ \hline 9/27/ & & & 22.11 & $16.43 & 2.04 \\ \hline 9/28 & & & & $16.44 & 8.14 \\ \hline & & & & & \\ \hline & & & & & \\ \hline 10 & & & & $16.36 & 108 \\ \hline \end{tabular} Nuclear Electric Power Production (Billion KWH)
Step by Step Solution
There are 3 Steps involved in it

Get step-by-step solutions from verified subject matter experts