

Question: Problem. The following table contains price-demand and total cpst'data for the production of regular sleeping blankets, where p the wholesale price (in dollars) of'a sleeping
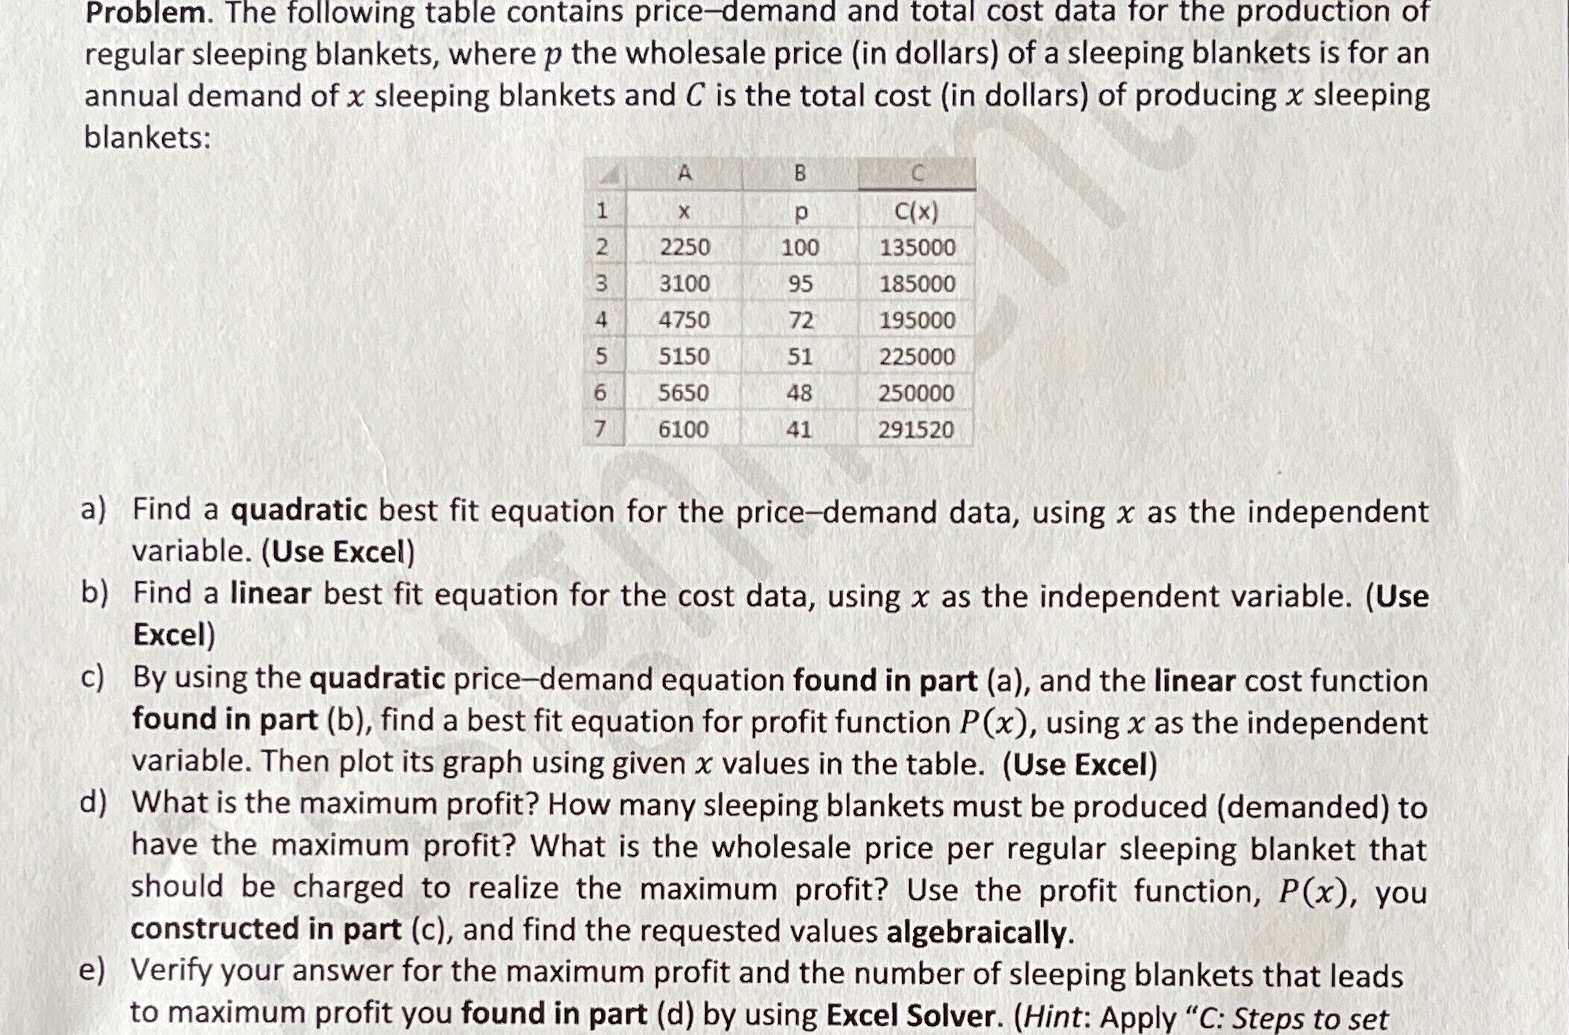

Problem. The following table contains price-demand and total cpst'data for the production of regular sleeping blankets, where p the wholesale price (in dollars) of'a sleeping blankets is for an annual demand of x sleeping blankets and C is the total cost (in dollars) of producing x sleeping blankets: . 3) Find a quadratic best t equation for the pricedemand data, using x as the independent variable. (Use Excel) b) Find a linear best t equation for the cost data using x as the independent variable. (Use Excel) . c) By using the quadratic pricedemand equation found in part (a), and the linear cost function found in part (b), nd a best t equation for prot function P(x), using x as the independent variable. Then plot its graph using given x values in the table. (Use Excel) d) What is the maximum prot? How many sleeping blankets must be produced (demanded) to have the maximum profit? What is the wholesale price per regular sleeping blanket that should be charged to realize the maximum prot? Use the prot function P(x), you constructed in part (c), and nd the requested values algebraically. e) Verify your answer for the maximum prot and the number of sleeping blankets that leads ' to maximum prot you found in part (d) by using Excel Solver. (Hint: Apply "C: Steps to set
Step by Step Solution
There are 3 Steps involved in it

Get step-by-step solutions from verified subject matter experts