

Question: Problem / The table below gives data on money stock and real and nominal GDP for 2011, and the money stock for 2011 through 2015.
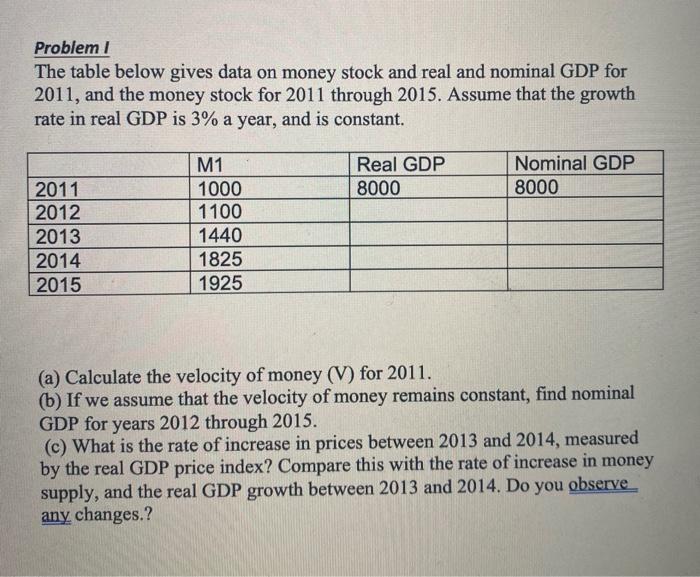
Problem / The table below gives data on money stock and real and nominal GDP for 2011, and the money stock for 2011 through 2015. Assume that the growth rate in real GDP is 3% a year, and is constant. Real GDP 8000 Nominal GDP 8000 2011 2012 2013 2014 2015 M1 1000 1100 1440 1825 1925 (a) Calculate the velocity of money (V) for 2011. (b) If we assume that the velocity of money remains constant, find nominal GDP for years 2012 through 2015. (c) What is the rate of increase in prices between 2013 and 2014, measured by the real GDP price index? Compare this with the rate of increase in money supply, and the real GDP growth between 2013 and 2014. Do you observe any changes
Step by Step Solution
There are 3 Steps involved in it

Get step-by-step solutions from verified subject matter experts