Question: Problem Value: 1 points). Problem Score: 21%. Attempts Remaining: Unlimited (1 point) Law enforcement agencies in Charlotte, NC conduct an average of 120,000 traffic stops
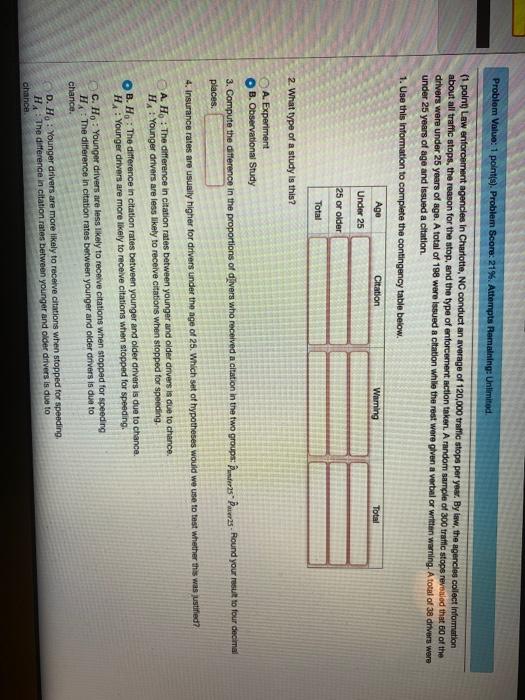
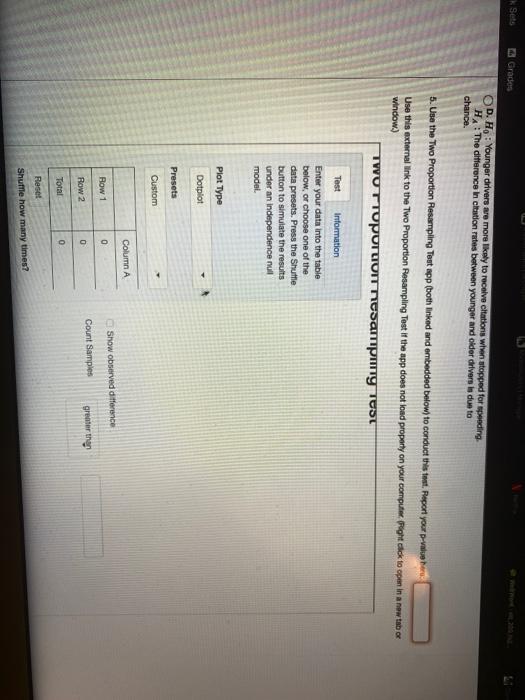
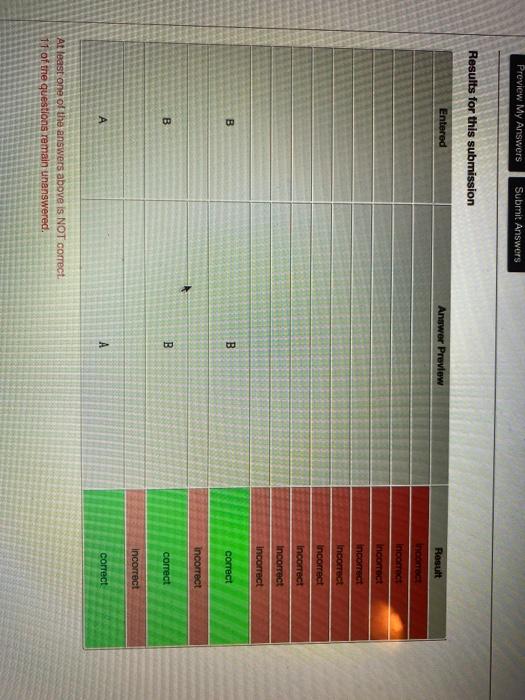
Problem Value: 1 points). Problem Score: 21%. Attempts Remaining: Unlimited (1 point) Law enforcement agencies in Charlotte, NC conduct an average of 120,000 traffic stops per year. By law, the agencies collect information about all traffic stops, the reason for the stop, and the type of enforcement action taken. A random sample of 300 traffic stops revealed that 60 of the drivers were under 25 years of age. A total of 198 were issued a citation while the rest were given a verbal or written warning. A total of 38 drivers were under 25 years of age and issued a citation 1. Use this information to complete the contingency table below. Age Citation Warning Total Under 25 25 or older Total 2. What type of a study is this? A. Experiment OB. Observational Study 3. Compute the difference in the proportions of divers who received a citation in the two groups andrs Pavers. Round your result to four decimal places. 4. Insurance rates are usually higher for drivers under the age of 25. Which set of hypotheses would we use to test whether this was ustified? A. H : The difference in citation rates between younger and older anvers is due to chance. H1 Younger drivers are less likely to receive citations when stopped for speeding, B. H, The difference in citation rates between younger and older drivers is due to chance. H: Younger drivers are more likely to receive citations when stopped for speeding. C. Ho : Younger drivers are less likely to receive citations when stopped for speeding H: The difference in citation rates between younger and older drivers is due to chance. D. H : Younger drivers are more likely to receive citations when stopped for speeding, H: The difference in citation rates between younger and older drivers is due to chance KS Grades D. H : Younger drivers are more likely to receive citations when stopped for speeding H: The difference in citation rates between younger and older drivers is due to chance. 5. Use the Two Proportion Resampling Test app (both linked and embedded below) to conduct this test. Report your p-value here Use this external link to the Two Proportion Resampling Test if the app does not load property on your computer Pight click to open in a new tab or window.) TWO TroporcioIT Tosamping TOST Test Information Enter your data into the table below, or choose one of the data presets. Press the Shuttle button to simulate the results under an independence null model. Plot Type Dotplot Presets Custom Column A 0 Show observed difference Row 1 Count Samples Row 2 D greater the Total 0 Reset Shuffle how many times? Preview My Answers Submit Answers Results for this submission Entered Answer Preview Result inoamoct incorrect Incorrect incorect Incorrect Incorrect Incorrect Incorrect Incorrect B B correct incorrect B B correct Incorrect correct At least one of the answers above is NOT correct 11 of the questions remain unanswered. Problem Value: 1 points). Problem Score: 21%. Attempts Remaining: Unlimited (1 point) Law enforcement agencies in Charlotte, NC conduct an average of 120,000 traffic stops per year. By law, the agencies collect information about all traffic stops, the reason for the stop, and the type of enforcement action taken. A random sample of 300 traffic stops revealed that 60 of the drivers were under 25 years of age. A total of 198 were issued a citation while the rest were given a verbal or written warning. A total of 38 drivers were under 25 years of age and issued a citation 1. Use this information to complete the contingency table below. Age Citation Warning Total Under 25 25 or older Total 2. What type of a study is this? A. Experiment OB. Observational Study 3. Compute the difference in the proportions of divers who received a citation in the two groups andrs Pavers. Round your result to four decimal places. 4. Insurance rates are usually higher for drivers under the age of 25. Which set of hypotheses would we use to test whether this was ustified? A. H : The difference in citation rates between younger and older anvers is due to chance. H1 Younger drivers are less likely to receive citations when stopped for speeding, B. H, The difference in citation rates between younger and older drivers is due to chance. H: Younger drivers are more likely to receive citations when stopped for speeding. C. Ho : Younger drivers are less likely to receive citations when stopped for speeding H: The difference in citation rates between younger and older drivers is due to chance. D. H : Younger drivers are more likely to receive citations when stopped for speeding, H: The difference in citation rates between younger and older drivers is due to chance KS Grades D. H : Younger drivers are more likely to receive citations when stopped for speeding H: The difference in citation rates between younger and older drivers is due to chance. 5. Use the Two Proportion Resampling Test app (both linked and embedded below) to conduct this test. Report your p-value here Use this external link to the Two Proportion Resampling Test if the app does not load property on your computer Pight click to open in a new tab or window.) TWO TroporcioIT Tosamping TOST Test Information Enter your data into the table below, or choose one of the data presets. Press the Shuttle button to simulate the results under an independence null model. Plot Type Dotplot Presets Custom Column A 0 Show observed difference Row 1 Count Samples Row 2 D greater the Total 0 Reset Shuffle how many times? Preview My Answers Submit Answers Results for this submission Entered Answer Preview Result inoamoct incorrect Incorrect incorect Incorrect Incorrect Incorrect Incorrect Incorrect B B correct incorrect B B correct Incorrect correct At least one of the answers above is NOT correct 11 of the questions remain unanswered