

Question: Problem You will be processing the experimental data from the forced response tests of the single - story building model. The experimental data is available
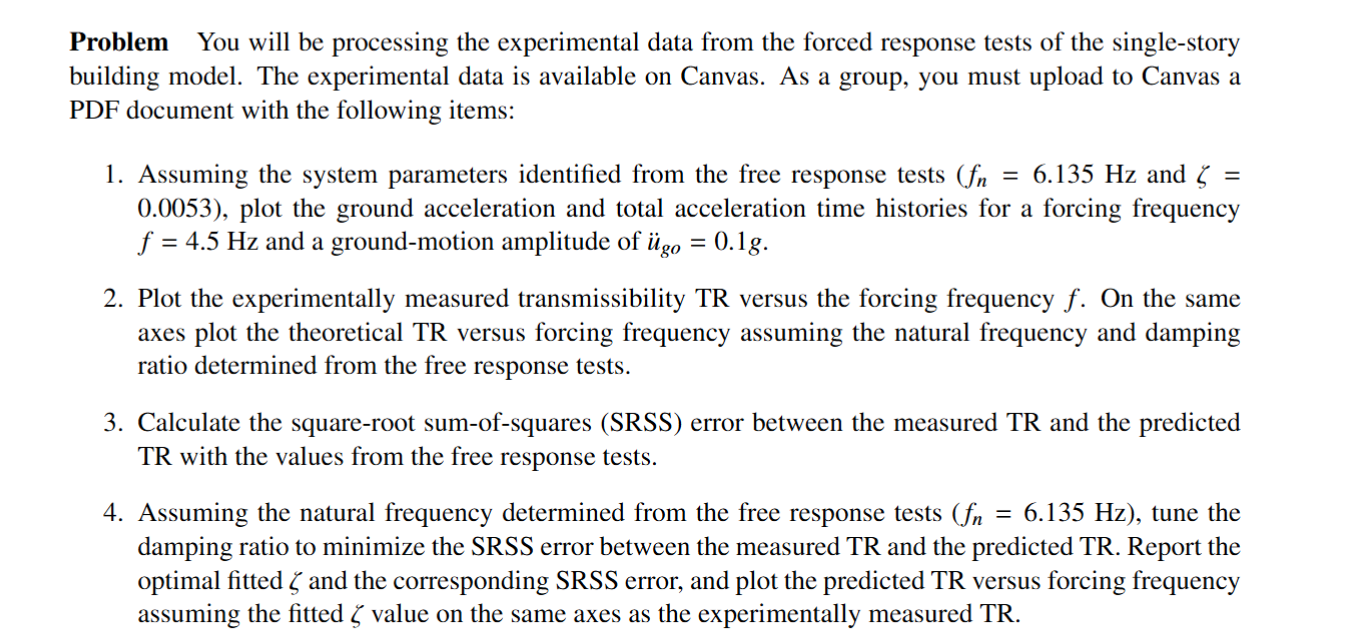
Problem You will be processing the experimental data from the forced response tests of the singlestory building model. The experimental data is available on Canvas. As a group, you must upload to Canvas a PDF document with the following items:
Assuming the system parameters identified from the free response tests leftfnmathrm~Hzright and zeta plot the ground acceleration and total acceleration time histories for a forcing frequency fmathrm~Hz and a groundmotion amplitude of ddotug omathrm~g
Plot the experimentally measured transmissibility TR versus the forcing frequency f On the same axes plot the theoretical TR versus forcing frequency assuming the natural frequency and damping ratio determined from the free response tests.
Calculate the squareroot sumofsquares SRSS error between the measured TR and the predicted TR with the values from the free response tests.
Assuming the natural frequency determined from the free response tests fnmathrm~Hz tune the damping ratio to minimize the SRSS error between the measured TR and the predicted TR Report the optimal fitted zeta and the corresponding SRSS error, and plot the predicted TR versus forcing frequency assuming the fitted zeta value on the same axes as the experimentally measured TR
Step by Step Solution
There are 3 Steps involved in it
1 Expert Approved Answer
Step: 1 Unlock

Question Has Been Solved by an Expert!
Get step-by-step solutions from verified subject matter experts
Step: 2 Unlock
Step: 3 Unlock