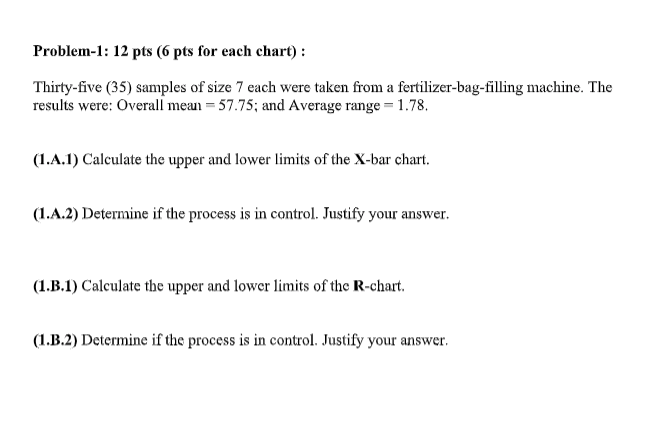
Question: Problem-1: 12 pts (6 pts for each chart): Thirty-five (35) samples of size 7 each were taken from a fertilizer-bag-filling machine. The results were: Overall

Problem-1: 12 pts (6 pts for each chart):

Problem-1: 12 pts (6 pts for each chart): Thirty-five (35) samples of size 7 each were taken from a fertilizer-bag-filling machine. The results were: Overall mean = 57.75; and Average range = 1.78. (1.A.1) Calculate the upper and lower limits of the X-bar chart. (1.A.2) Determine if the process is in control. Justify your answer. (1.B.1) Calculate the upper and lower limits of the R-chart. (1.B.2) Determine if the process is in control. Justify your answer. Problem-1: 12 pts (6 pts for each chart): Thirty-five (35) samples of size 7 each were taken from a fertilizer-bag-filling machine. The results were: Overall mean = 57.75; and Average range = 1.78. (1.A.1) Calculate the upper and lower limits of the X-bar chart. (1.A.2) Determine if the process is in control. Justify your answer. (1.B.1) Calculate the upper and lower limits of the R-chart. (1.B.2) Determine if the process is in control. Justify your

Step by Step Solution

There are 3 Steps involved in it

1 Expert Approved Answer
Step: 1 Unlock blur-text-image
Question Has Been Solved by an Expert!

Get step-by-step solutions from verified subject matter experts

Step: 2 Unlock
Step: 3 Unlock

Students Have Also Explored These Related General Management Questions!