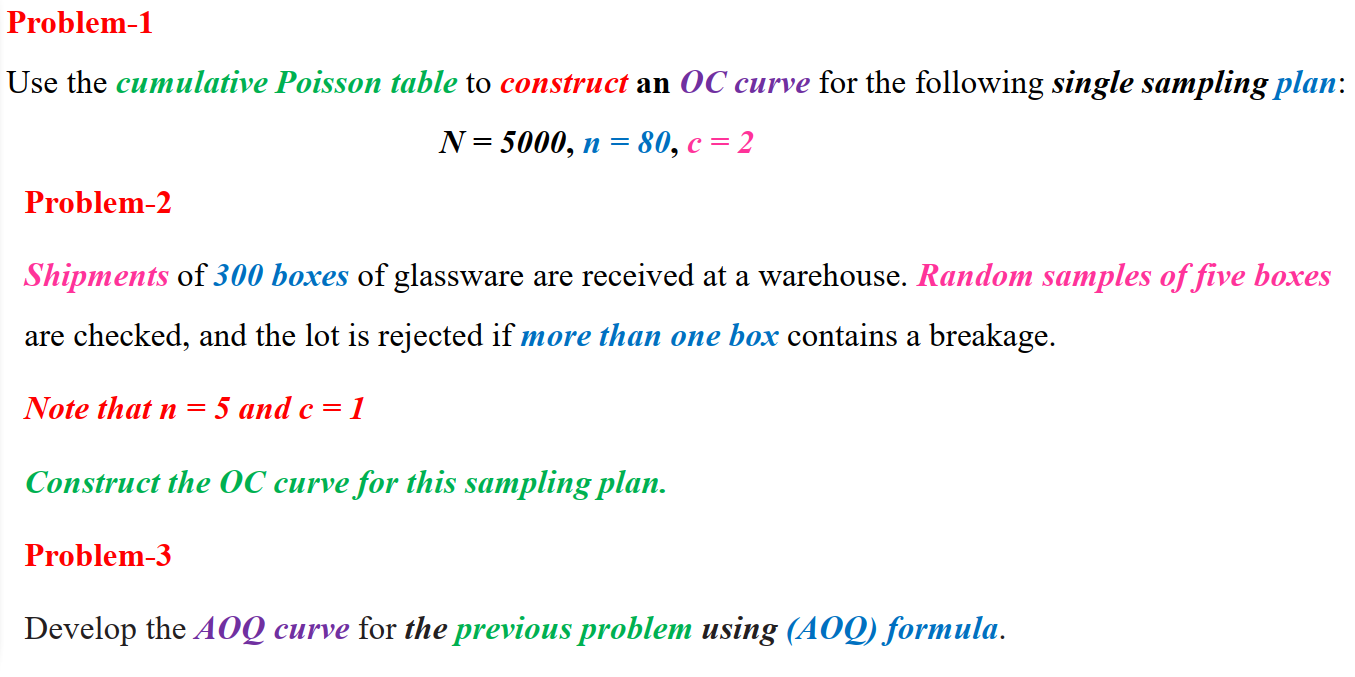
Question: Problem-1 Use the cumulative Poisson table to construct an OC curve for the following single sampling plan: N= 5000, n = 80, c = 2

Problem-1 Use the cumulative Poisson table to

Problem-1 Use the cumulative Poisson table to construct an OC curve for the following single sampling plan: N= 5000, n = 80, c = 2 = Problem-2 Shipments of 300 boxes of glassware are received at a warehouse. Random samples of five boxes are checked, and the lot is rejected if more than one box contains a breakage. Note that n = 5 and c=1 = Construct the OC curve for this sampling plan. Problem-3 Develop the AOQ curve for the previous problem using (AOQ) formula

Step by Step Solution

There are 3 Steps involved in it

1 Expert Approved Answer
Step: 1 Unlock blur-text-image
Question Has Been Solved by an Expert!

Get step-by-step solutions from verified subject matter experts

Step: 2 Unlock
Step: 3 Unlock

Students Have Also Explored These Related General Management Questions!