

Question: Problem-2: Consider the data for Lavare in Problem 1. We now assume that Lavare can change the size of the workforce by laying off or
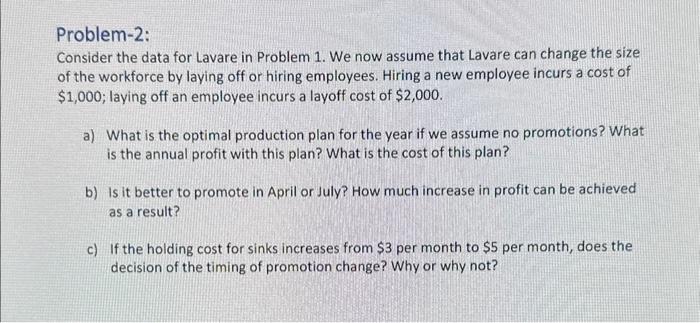
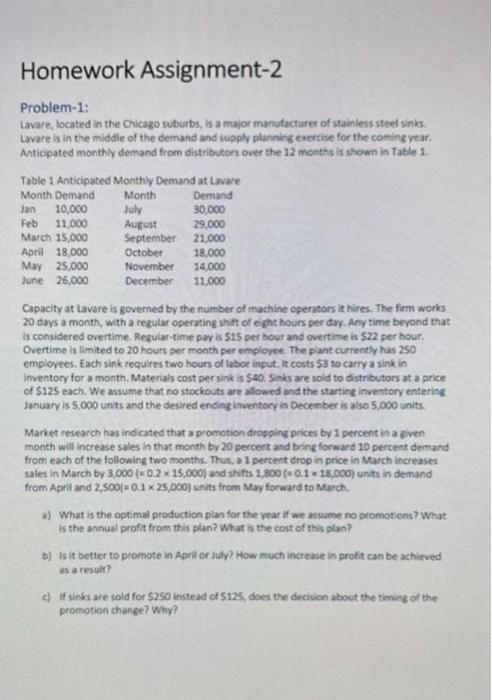
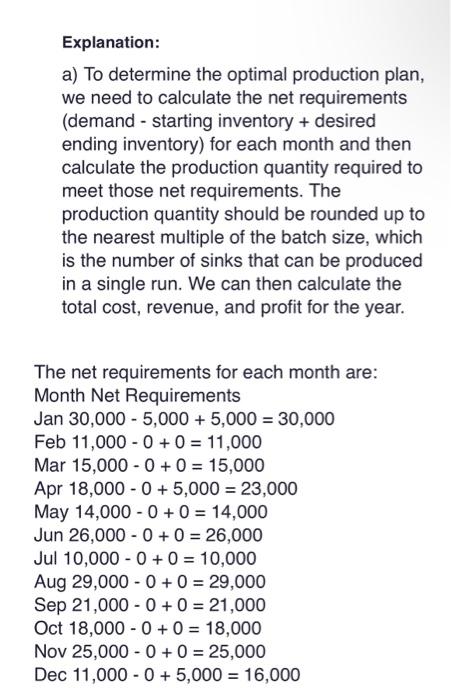
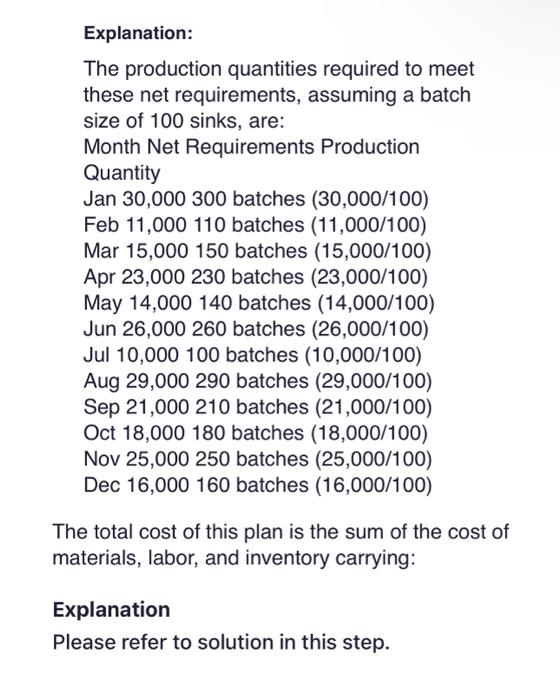
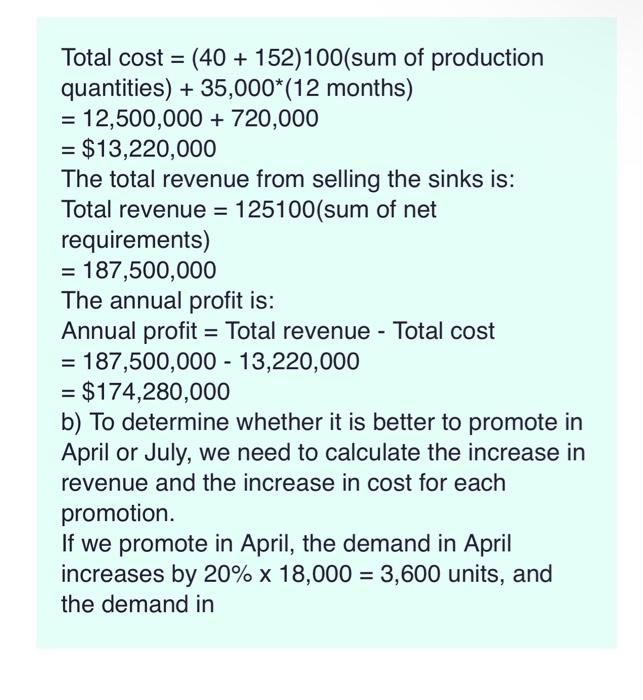
Problem-2: Consider the data for Lavare in Problem 1. We now assume that Lavare can change the size of the workforce by laying off or hiring employees. Hiring a new employee incurs a cost of $1,000; laying off an employee incurs a layoff cost of $2,000. a) What is the optimal production plan for the year if we assume no promotions? What is the annual profit with this plan? What is the cost of this plan? b) Is it better to promote in April or July? How much increase in profit can be achieved as a result? c) If the holding cost for sinks increases from $3 per month to $5 per month, does the decision of the timing of promotion change? Why or why not? Problem-1: Lavare, located in the Chicago suburbs, is a major manutacturer of stainless steel sinis. Lavare is in the middle of the demand and supply planning exertise for the coming year. Anticipated monthly demand from diatributon over the 12 months is shown in Table 1. Capacity at Lavare is governed by the number of machine operators it hires. The firm works 20 days a month, with a regular operoting shift of eght hours per dry. Any time beyond that Is considered overtime. Rezular-time pay a $15 per bour and overtime is $22 per hour. Overtime is limited to 20 hours per mooth per emplopee. The pant currently has 250 employees. Each sink requires two hours of labor input, it costs $3 to carry a sink in Inventory for a month. Moterials cost per sink is $40. Sinks are sold to distributors at a price of $125 each. We assume that no stockouts are allowed and the starting inventory entering january is 5,000 unts and the desired ending inventory in Decenber is also 5,000 units. Market research has indicated that a promotion dropging prices by 1 percent in a given month will increase sales in that month by 20 percent and bring forward 10 percent demand from each of the following two months. Thus, a 1 percent drop in price in March increases sales in March by 3,000(=0.215,000) and stifts 1,800(=0.118,000) units in demand from April and 2,500(: 0.125,000) units from May foreard to March. a) What is the optimal production plan for the year if we atwume no promoticns? What is the annual profit from this plan? What is the cost of this plan? Explanation: a) To determine the optimal production plan, we need to calculate the net requirements (demand - starting inventory + desired ending inventory) for each month and then calculate the production quantity required to meet those net requirements. The production quantity should be rounded up to the nearest multiple of the batch size, which is the number of sinks that can be produced in a single run. We can then calculate the total cost, revenue, and profit for the year. The net requirements for each month are: Month Net Requirements Jan30,0005,000+5,000=30,000 Feb 11,0000+0=11,000 Mar 15,000-0+0 =15,000 Apr 18,0000+5,000=23,000 May 14,000 - 0+0=14,000 Jun 26,0000+0=26,000 Jul 10,0000+0=10,000 Aug 29,000-0+0 =29,000 Sep 21,0000+0=21,000 Oct 18,0000+0=18,000 Nov 25,0000+0=25,000 Dec 11,0000+5,000=16,000 Explanation: The production quantities required to meet these net requirements, assuming a batch size of 100 sinks, are: Month Net Requirements Production Quantity Jan 30,000300 batches (30,000/100) Feb 11,000 110 batches (11,000/100) Mar 15,000 150 batches (15,000/100) Apr 23,000 230 batches (23,000/100) May 14,000140 batches (14,000/100) Jun 26,000260 batches (26,000/100) Jul 10,000100 batches (10,000/100) Aug 29,000290 batches (29,000/100) Sep 21,000210 batches (21,000/100) Oct 18,000180 batches (18,000/100) Nov 25,000250 batches (25,000/100) Dec 16,000160 batches (16,000/100) The total cost of this plan is the sum of the cost of materials, labor, and inventory carrying: Explanation Please refer to solution in this step. Total cost =(40+152)100 (sum of production quantities) +35,000(12 months) =12,500,000+720,000 =$13,220,000 The total revenue from selling the sinks is: Total revenue =125100 (sum of net requirements) =187,500,000 The annual profit is: Annual profit = Total revenue - Total cost =187,500,00013,220,000 =$174,280,000 b) To determine whether it is better to promote in April or July, we need to calculate the increase in revenue and the increase in cost for each promotion. If we promote in April, the demand in April increases by 20%18,000=3,600 units, and the demand in Problem-2: Consider the data for Lavare in Problem 1. We now assume that Lavare can change the size of the workforce by laying off or hiring employees. Hiring a new employee incurs a cost of $1,000; laying off an employee incurs a layoff cost of $2,000. a) What is the optimal production plan for the year if we assume no promotions? What is the annual profit with this plan? What is the cost of this plan? b) Is it better to promote in April or July? How much increase in profit can be achieved as a result? c) If the holding cost for sinks increases from $3 per month to $5 per month, does the decision of the timing of promotion change? Why or why not? Problem-1: Lavare, located in the Chicago suburbs, is a major manutacturer of stainless steel sinis. Lavare is in the middle of the demand and supply planning exertise for the coming year. Anticipated monthly demand from diatributon over the 12 months is shown in Table 1. Capacity at Lavare is governed by the number of machine operators it hires. The firm works 20 days a month, with a regular operoting shift of eght hours per dry. Any time beyond that Is considered overtime. Rezular-time pay a $15 per bour and overtime is $22 per hour. Overtime is limited to 20 hours per mooth per emplopee. The pant currently has 250 employees. Each sink requires two hours of labor input, it costs $3 to carry a sink in Inventory for a month. Moterials cost per sink is $40. Sinks are sold to distributors at a price of $125 each. We assume that no stockouts are allowed and the starting inventory entering january is 5,000 unts and the desired ending inventory in Decenber is also 5,000 units. Market research has indicated that a promotion dropging prices by 1 percent in a given month will increase sales in that month by 20 percent and bring forward 10 percent demand from each of the following two months. Thus, a 1 percent drop in price in March increases sales in March by 3,000(=0.215,000) and stifts 1,800(=0.118,000) units in demand from April and 2,500(: 0.125,000) units from May foreard to March. a) What is the optimal production plan for the year if we atwume no promoticns? What is the annual profit from this plan? What is the cost of this plan? Explanation: a) To determine the optimal production plan, we need to calculate the net requirements (demand - starting inventory + desired ending inventory) for each month and then calculate the production quantity required to meet those net requirements. The production quantity should be rounded up to the nearest multiple of the batch size, which is the number of sinks that can be produced in a single run. We can then calculate the total cost, revenue, and profit for the year. The net requirements for each month are: Month Net Requirements Jan30,0005,000+5,000=30,000 Feb 11,0000+0=11,000 Mar 15,000-0+0 =15,000 Apr 18,0000+5,000=23,000 May 14,000 - 0+0=14,000 Jun 26,0000+0=26,000 Jul 10,0000+0=10,000 Aug 29,000-0+0 =29,000 Sep 21,0000+0=21,000 Oct 18,0000+0=18,000 Nov 25,0000+0=25,000 Dec 11,0000+5,000=16,000 Explanation: The production quantities required to meet these net requirements, assuming a batch size of 100 sinks, are: Month Net Requirements Production Quantity Jan 30,000300 batches (30,000/100) Feb 11,000 110 batches (11,000/100) Mar 15,000 150 batches (15,000/100) Apr 23,000 230 batches (23,000/100) May 14,000140 batches (14,000/100) Jun 26,000260 batches (26,000/100) Jul 10,000100 batches (10,000/100) Aug 29,000290 batches (29,000/100) Sep 21,000210 batches (21,000/100) Oct 18,000180 batches (18,000/100) Nov 25,000250 batches (25,000/100) Dec 16,000160 batches (16,000/100) The total cost of this plan is the sum of the cost of materials, labor, and inventory carrying: Explanation Please refer to solution in this step. Total cost =(40+152)100 (sum of production quantities) +35,000(12 months) =12,500,000+720,000 =$13,220,000 The total revenue from selling the sinks is: Total revenue =125100 (sum of net requirements) =187,500,000 The annual profit is: Annual profit = Total revenue - Total cost =187,500,00013,220,000 =$174,280,000 b) To determine whether it is better to promote in April or July, we need to calculate the increase in revenue and the increase in cost for each promotion. If we promote in April, the demand in April increases by 20%18,000=3,600 units, and the demand in
Step by Step Solution
There are 3 Steps involved in it

Get step-by-step solutions from verified subject matter experts