

Question: Problems 1. Consider the data collected from a sample of drivers using a survey about their demographics, commuting needs/behavior, and whether or not they are
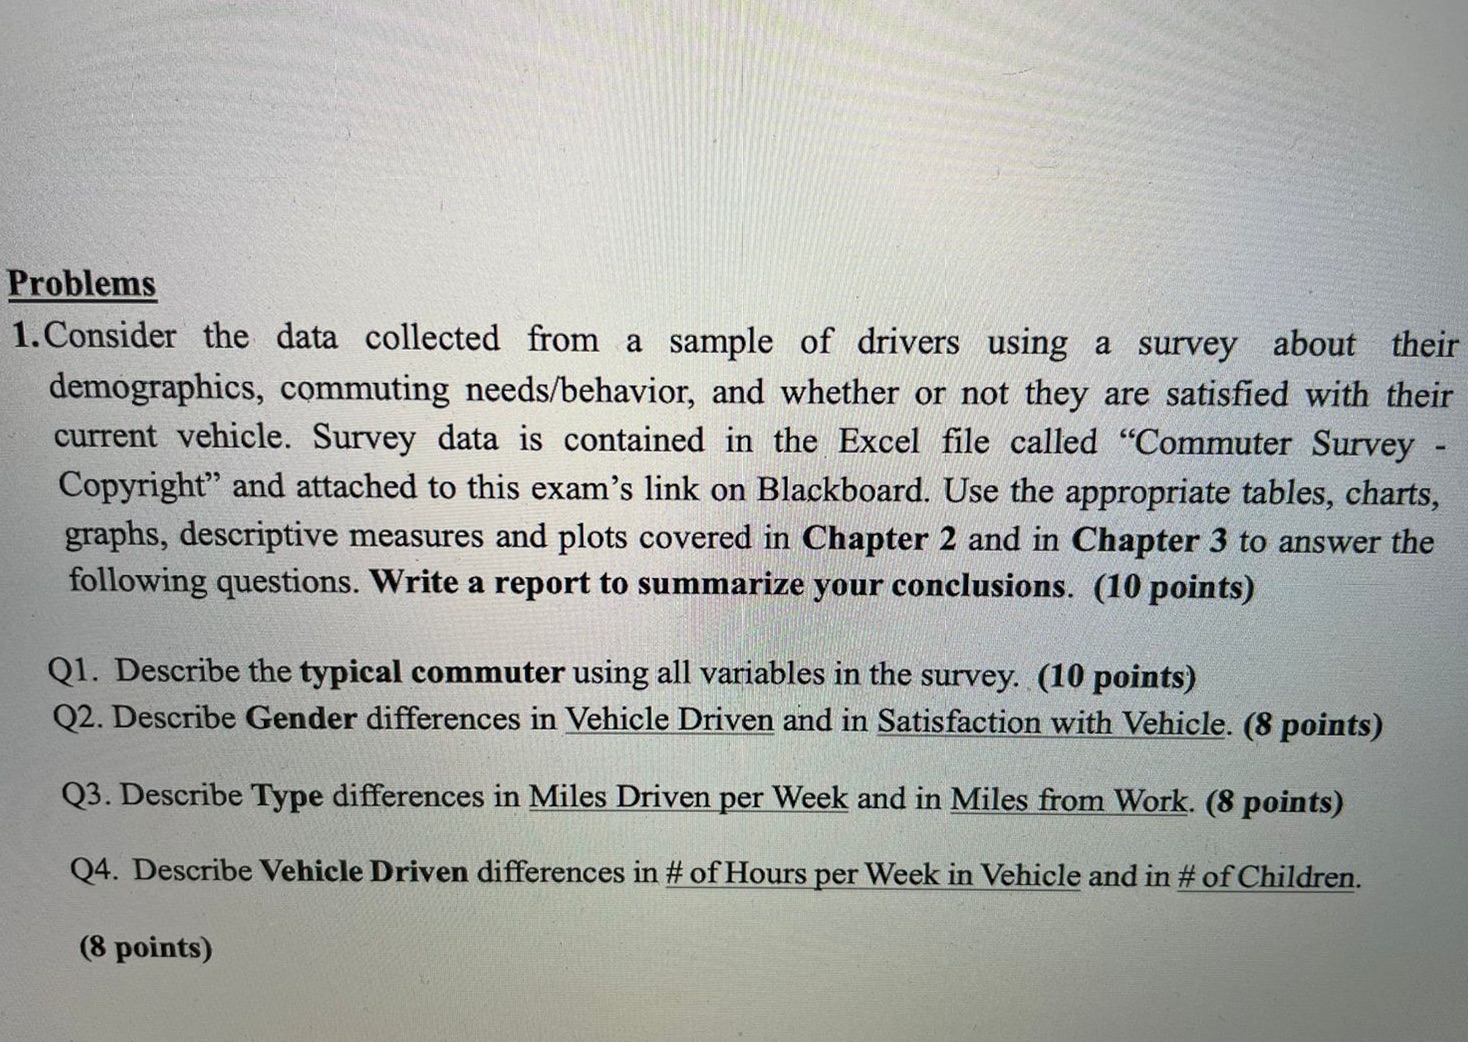
Problems 1. Consider the data collected from a sample of drivers using a survey about their demographics, commuting needs/behavior, and whether or not they are satisfied with their current vehicle. Survey data is contained in the Excel file called "Commuter Survey - Copyright" and attached to this exam's link on Blackboard. Use the appropriate tables, charts, graphs, descriptive measures and plots covered in Chapter 2 and in Chapter 3 to answer the following questions. Write a report to summarize your conclusions. (10 points) Q1. Describe the typical commuter using all variables in the survey. (10 points) Q2. Describe Gender differences in Vehicle Driven and in Satisfaction with Vehicle. (8 points) Q3. Describe Type differences in Miles Driven per Week and in Miles from Work. (8 points) Q4. Describe Vehicle Driven differences in # of Hours per Week in Vehicle and in # of Children. (8 points)
Step by Step Solution
There are 3 Steps involved in it

Get step-by-step solutions from verified subject matter experts