

Question: Problems 1 through 4: Cost Function Analysis The following graph provides information on cost (in dollars) as a function of quantity (in units) produced: 1
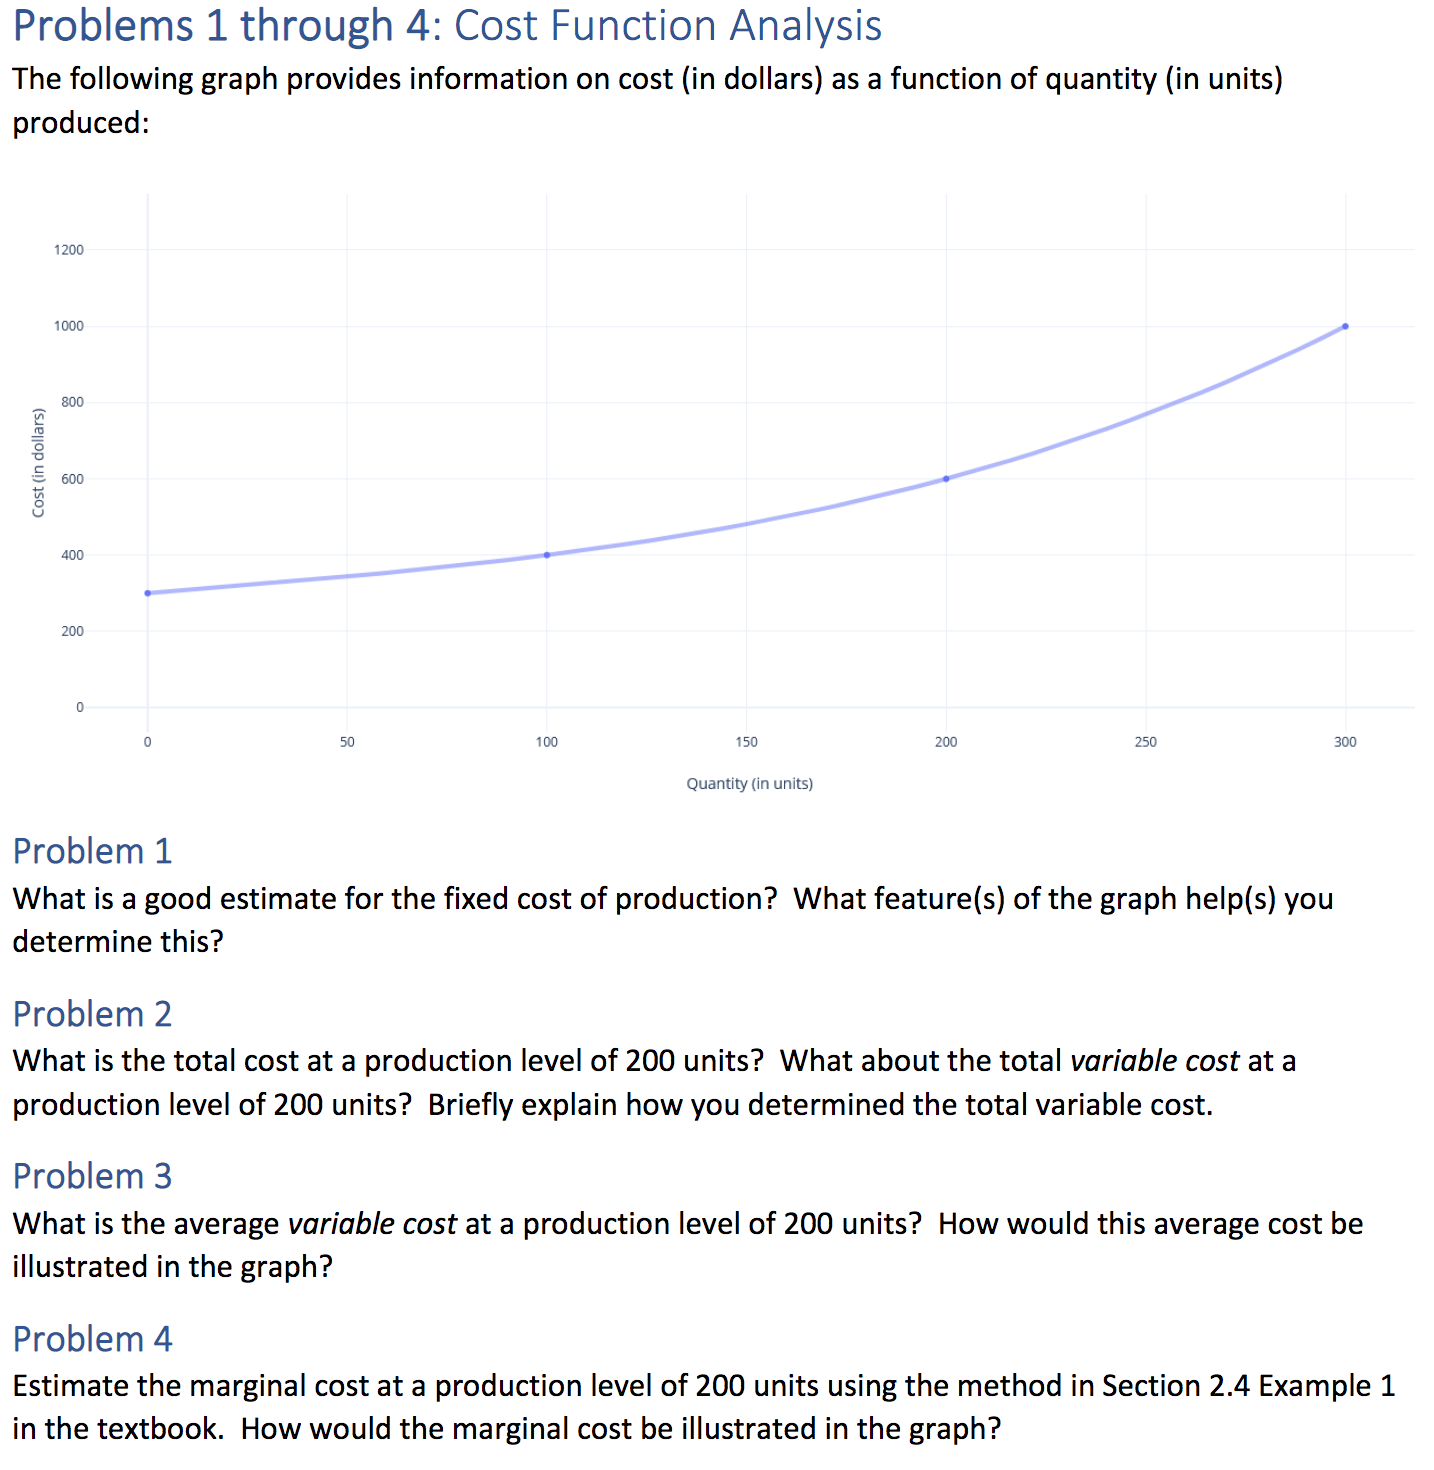
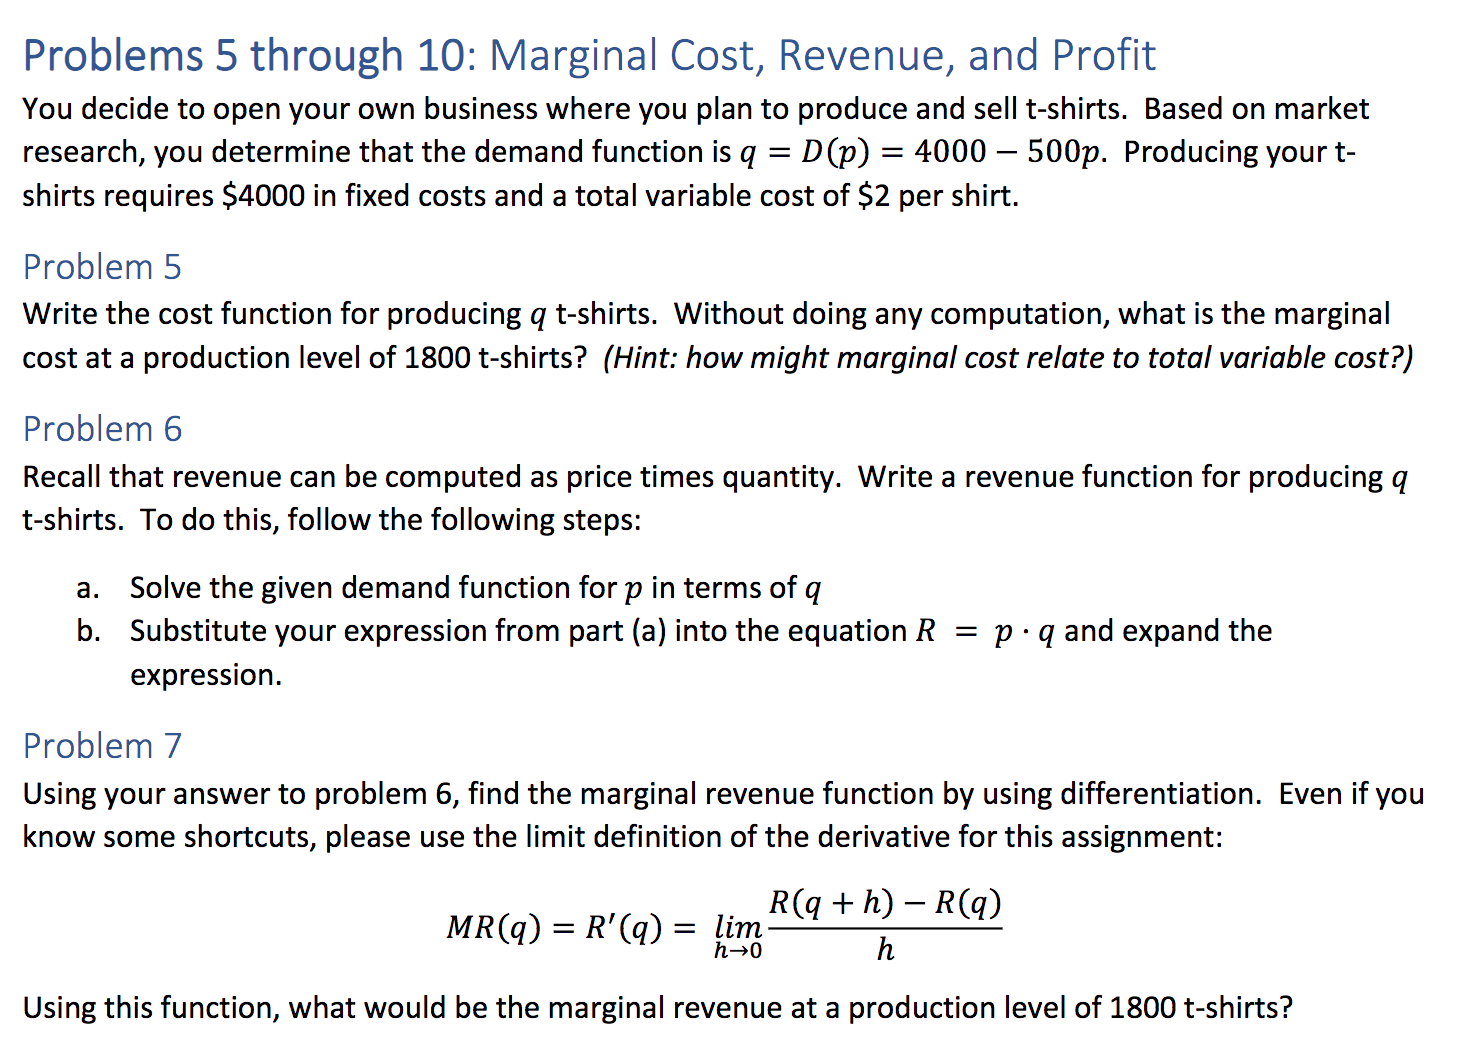
Problems 1 through 4: Cost Function Analysis The following graph provides information on cost (in dollars) as a function of quantity (in units) produced: 1 200 'l 000 800 600 Costiin dollars) 400 200 0 50 1 00 1 SD 200 250 300 Quantity (in units) Problem 1 What is a good estimate for the fixed cost of production? What feature(s) of the graph help(s) you determine this? Problem 2 What is the total cost at a production level of 200 units? What about the total variable cost at a production level of 200 units? Briefly explain how you determined the total variable cost. Problem 3 What is the average variable cost at a production level of 200 units? How would this average cost be illustrated in the graph? Problem 4 Estimate the marginal cost at a production level of 200 units using the method in Section 2.4 Example 1 in the textbook. How would the marginal cost be illustrated in the graph? Problems 5 through 10: Marginal Cost, Revenue, and Profit You decide to open your own business where you plan to produce and sell t-shirts. Based on market research, you determine that the demand function is q = D(p) = 4000 500p. Producing your t- shirts requires $4000 in fixed costs and a total variable cost of $2 per shirt. Problem 5 Write the cost function for producing q t-shirts. Without doing any computation, what is the marginal cost at a production level of 1800 t-shirts? (Hint: how might marginal cost relate to total variable cost?) Problem 6 Recall that revenue can be computed as price times quantity. Write a revenue function for producing q t-shirts. To do this, follow the following steps: a. Solve the given demand function for p in terms of q b. Substitute your expression from part (a) into the equation R = p - q and expand the expression. Problem 7 Using your answer to problem 6, find the marginal revenue function by using differentiation. Even if you know some shortcuts, please use the limit definition of the derivative for this assignment: R h R Using this function, what would be the marginal revenue at a production level of 1800 t-shirts? Problem 8 Compare the marginal cost from Problem 5 with the marginal revenue from Problem 7. Based on this comparison, does it seem wise to increase production beyond 1800 t-shirts? Use common sense to explain why or why not. Problem 9 Using a free online graphing calculator, plot the cost function and revenue function together. Draw a quick sketch by hand to submit with this assignment. What are the \"break-even\" points? How can you tell? Problem 10 Recall that profit can be determined by finding the difference between revenue and cost. Using the same graph from problem 9, at what production level (number of units produced) does it appear that this difference (profit) is greatest? At that location, how does the slope of the tangent line for the revenue function compare to the slope of the tangent line for the cost function? What does this seem to indicate about the relationship between marginal revenue, marginal cost, and maximum profit
Step by Step Solution
There are 3 Steps involved in it

Get step-by-step solutions from verified subject matter experts