

Question: Problems 13-18 are based on the demand and supply schedules for gasoline below (all quantities are in thousands of gallons per week Price per Gallon
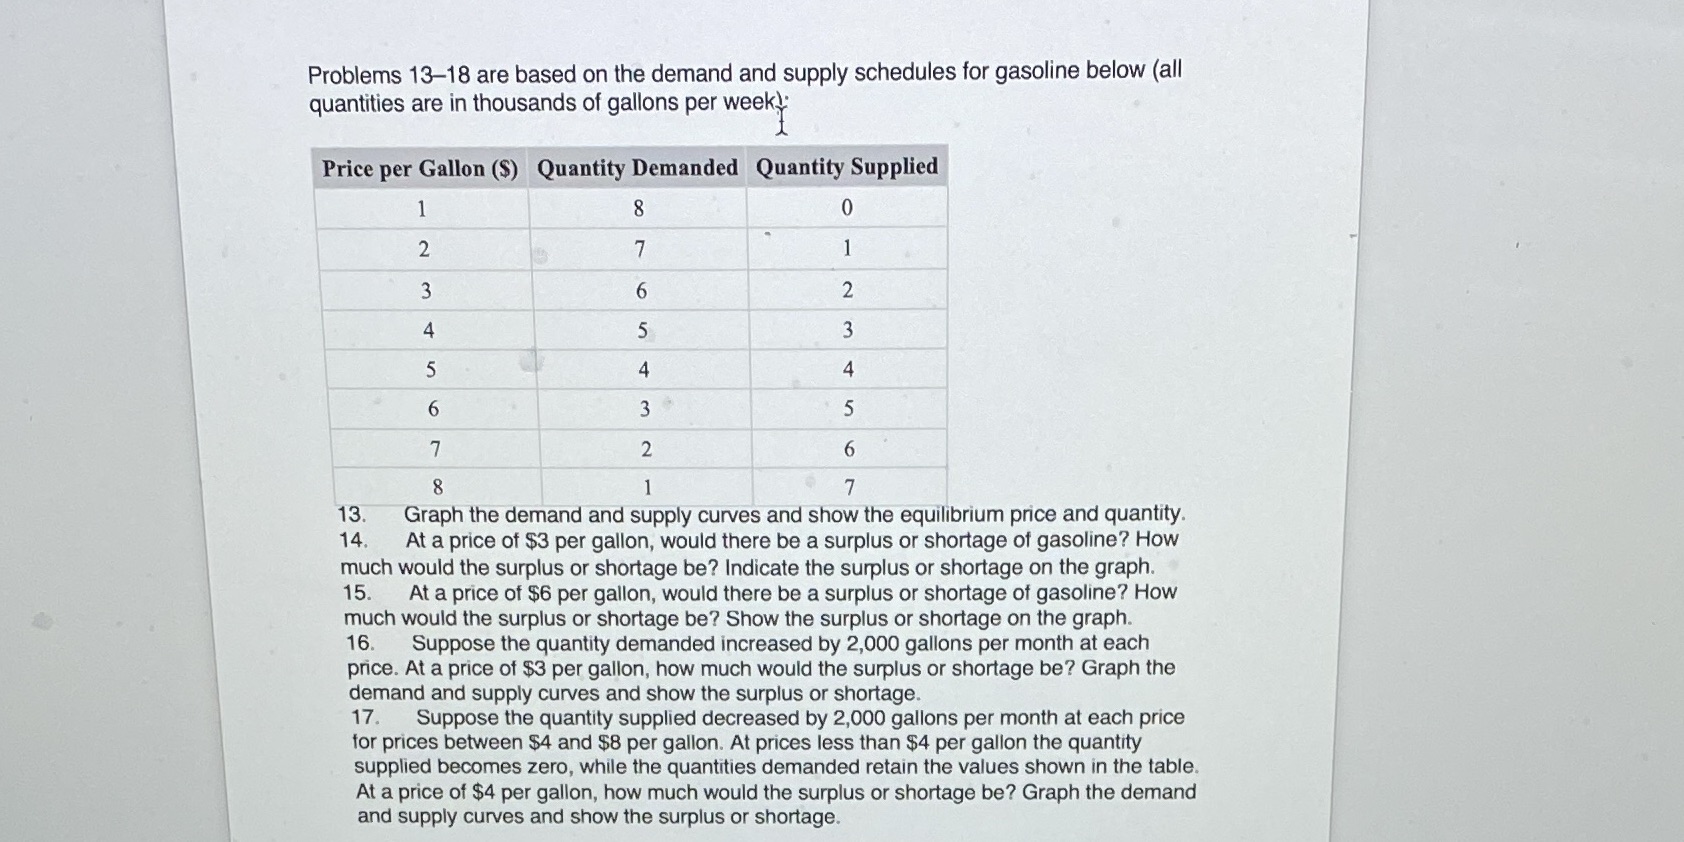
Problems 13-18 are based on the demand and supply schedules for gasoline below (all quantities are in thousands of gallons per week Price per Gallon ($) Quantity Demanded Quantity Supplied 8 0 N w 6 N U A w A A 6 W 7 N 6 8 7 13. Graph the demand and supply curves and show the equilibrium price and quantity. 14. At a price of $3 per gallon, would there be a surplus or shortage of gasoline? How much would the surplus or shortage be? Indicate the surplus or shortage on the graph. 15. At a price of $6 per gallon, would there be a surplus or shortage of gasoline? How much would the surplus or shortage be? Show the surplus or shortage on the graph. 16. Suppose the quantity demanded increased by 2,000 gallons per month at each price. At a price of $3 per gallon, how much would the surplus or shortage be? Graph the demand and supply curves and show the surplus or shortage. 17. Suppose the quantity supplied decreased by 2,000 gallons per month at each price for prices between $4 and $8 per gallon. At prices less than $4 per gallon the quantity supplied becomes zero, while the quantities demanded retain the values shown in the table. At a price of $4 per gallon, how much would the surplus or shortage be? Graph the demand and supply curves and show the surplus or shortage
Step by Step Solution
There are 3 Steps involved in it

Get step-by-step solutions from verified subject matter experts