

Question: Problems For the following problems, first download the Excel file titled Problem_Data_CH11.xlsx This spreadsheet contains four Excel worksheets: Sales, Products, Channels, and Stores. The main
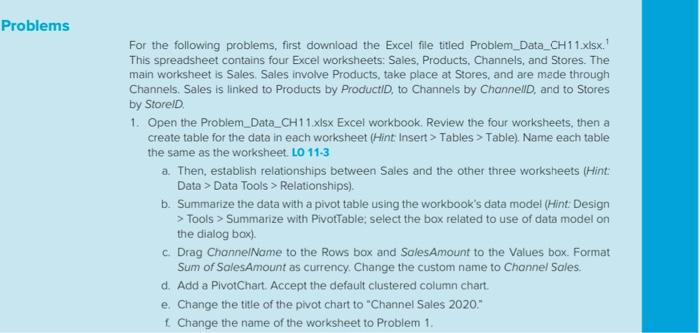
Problems For the following problems, first download the Excel file titled Problem_Data_CH11.xlsx This spreadsheet contains four Excel worksheets: Sales, Products, Channels, and Stores. The main worksheet is Sales. Sales involve Products, take place at Stores, and are made through Channels. Sales is linked to Products by ProductID, to Channels by ChannelD, and to Stores by StoreID 1. Open the Problem_Data_CH 11.xlsx Excel workbook Review the four worksheets, then a create table for the data in each worksheet (Hint: Insert > Tables > Table). Name each table the same as the worksheet. LO 11-3 a. Then, establish relationships between Sales and the other three worksheets (Hint: Data > Data Tools > Relationships). b. Summarize the data with a pivot table using the workbook's data model (Hint Design > Tools > Summarize with PivotTable; select the box related to use of data model on the dialog box) c Drag ChannelName to the Rows box and SalesAmount to the Values box. Format Sum of SalesAmount as currency. Change the custom name to Channel Sales. d. Add a PivotChart. Accept the default clustered column chart. e. Change the title of the pivot chart to "Channel Sales 2020." 1 Change the name of the worksheet to Problem 1. Problems For the following problems, first download the Excel file titled Problem_Data_CH11.xlsx This spreadsheet contains four Excel worksheets: Sales, Products, Channels, and Stores. The main worksheet is Sales. Sales involve Products, take place at Stores, and are made through Channels. Sales is linked to Products by ProductID, to Channels by ChannelD, and to Stores by StoreID 1. Open the Problem_Data_CH 11.xlsx Excel workbook Review the four worksheets, then a create table for the data in each worksheet (Hint: Insert > Tables > Table). Name each table the same as the worksheet. LO 11-3 a. Then, establish relationships between Sales and the other three worksheets (Hint: Data > Data Tools > Relationships). b. Summarize the data with a pivot table using the workbook's data model (Hint Design > Tools > Summarize with PivotTable; select the box related to use of data model on the dialog box) c Drag ChannelName to the Rows box and SalesAmount to the Values box. Format Sum of SalesAmount as currency. Change the custom name to Channel Sales. d. Add a PivotChart. Accept the default clustered column chart. e. Change the title of the pivot chart to "Channel Sales 2020." 1 Change the name of the worksheet to Problem 1
Step by Step Solution
There are 3 Steps involved in it

Get step-by-step solutions from verified subject matter experts