

Question: Procedure 1) Open file in Excel. 2) Calculate the returns for Netflix, Disney, and the S&P 500. The formula for percentage change is (This Month
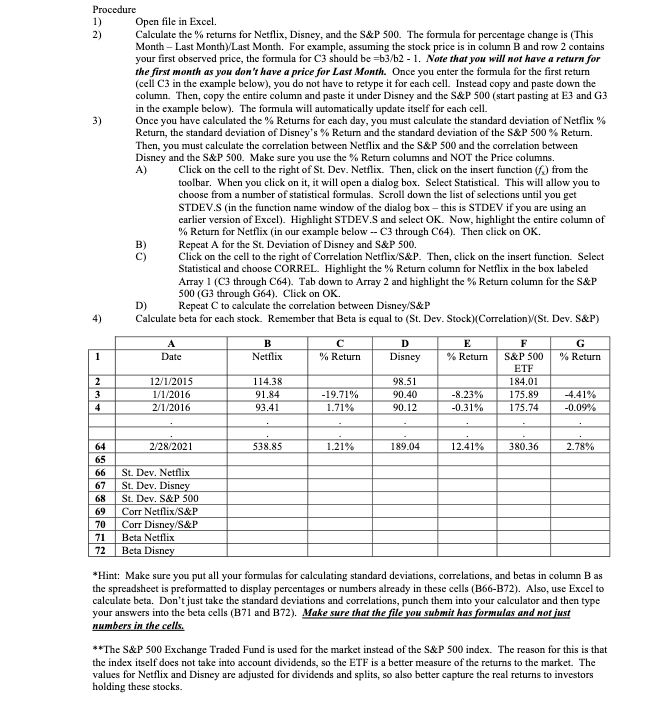
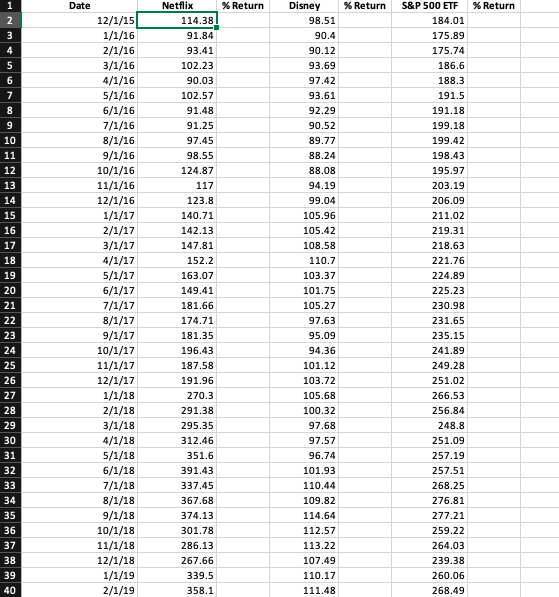
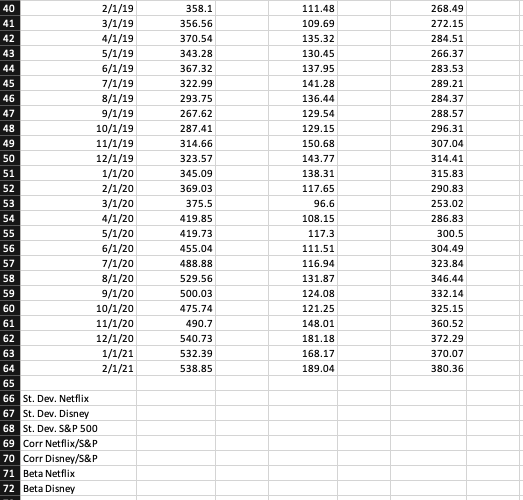
Procedure 1) Open file in Excel. 2) Calculate the returns for Netflix, Disney, and the S&P 500. The formula for percentage change is (This Month - Last MonthyLast Month. For example, assuming the stock price is in column B and row 2 contains your first observed price, the formula for C3 should be =b3/b2 - 1. Note that you will not have a return for the first month as you don't have a price for Last Month. Once you enter the formula for the first return (cell C3 in the example below), you do not have to retype it for each cell. Instead copy and paste down the column. Then, copy the entire column and paste it under Disney and the S&P 500 (start pasting at E3 and G3 in the example below). The formula will automatically update itself for each cell. 3) Once you have calculated the % Returns for each day, you must calculate the standard deviation of Netflix % Return, the standard deviation of Disney's % Return and the standard deviation of the S&P 500% Return. Then, you must calculate the correlation between Netflix and the S&P 500 and the correlation between Disney and the S&P 500. Make sure you use the % Return columns and NOT the Price columns. A) Click on the cell to the right of St. Dev. Netflix. Then, click on the insert function () from the toolbar. When you click on it, it will open a dialog box. Select Statistical. This will allow you to choose from a number of statistical formulas. Scroll down the list of selections until you get STDEV.S (in the function name window of the dialog box - this is STDEV if you are using an earlier version of Excel). Highlight STDEV.S and select OK. Now, highlight the entire column of % Return for Netflix (in our example below -- C3 through C64). Then click on OK. B) Repeat A for the St. Deviation of Disney and S&P 500. C) Click on the cell to the right of Correlation Netflix/S&P. Then, click on the insert function. Select Statistical and choose CORREL. Highlight the % Return column for Netflix in the box labeled Array 1 (C3 through C64). Tab down to Array 2 and highlight the % Return column for the S&P 500 (G3 through G64). Click on OK. D) Repeat C to calculate the correlation between Disney/S&P Calculate beta for each stock. Remember that Beta is equal to (St. Dev. Stock)(Correlation)(St. Dev. S&P) 4) B Netflix % Return D Disney E % Return G % Return 1 Date F S&P 500 ETF 184.01 175.89 175.74 2 3 4 12/1/2015 1/1/2016 2/1/2016 114.38 91.84 93.41 -19.71% 1.71% 98.51 90.40 90.12 -8.23% -0.31% -4.41% -0.09% 2/28/2021 538.85 1.21% 189.04 12.41% 380.36 2.78% 64 65 66 67 68 69 70 71 72 St. Dev. Netflix St. Dev. Disney St. Dev. S&P 500 Corr Netflix/S&P Corr Disney/S&P Beta Netflix Beta Disney *Hint: Make sure you put all your formulas for calculating standard deviations, correlations, and betas in column B as the spreadsheet is preformatted to display percentages or numbers already in these cells (B66-B72). Also, use Excel to calculate beta. Don't just take the standard deviations and correlations, punch them into your calculator and then type your answers into the beta cells (B71 and B72). Make sure that the file you submit has formulas and not just numbers in the cells. **The S&P 500 Exchange Traded Fund is used for the market instead of the S&P 500 index. The reason for this is that the index itself does not take into account dividends, so the ETF is a better measure of the returns to the market. The values for Netflix and Disney are adjusted for dividends and splits, so also better capture the real returns to investors holding these stocks. 1 % Return % Return % Return 2 3 SP 500 EIF 184.01 175.89 175.74 4 5 6 7 8 9 10 11 12 13 14 15 16 17 18 19 20 21 22 23 24 25 26 27 28 29 30 31 32 33 34 35 36 37 38 39 40 Date 12/1/15 1/1/16 2/1/16 3/1/16 4/1/16 5/1/16 6/1/16 7/1/16 8/1/16 9/1/16 10/1/16 11/1/16 12/1/16 1/1/17 2/1/17 3/1/17 4/1/17 5/1/17 6/1/17 7/1/17 8/1/17 9/1/17 10/1/17 11/1/17 12/1/17 1/1/18 2/1/18 3/1/18 4/1/18 5/1/18 6/1/18 7/1/18 8/1/18 9/1/18 10/1/18 11/1/18 12/1/18 1/1/19 2/1/19 Netflix 114.38 91.84 93.41 102.23 90.03 102.57 91.48 91.25 97.45 98.55 124.87 117 123.8 140.71 142.13 147.81 152.2 163.07 149.41 181.66 174.71 181.35 196.43 187.58 191.96 270.3 291.38 295.35 312.46 351.6 391.43 337.45 367.68 374.13 301.78 286.13 267.66 339.5 358.1 Disney 98.51 90.4 90.12 93.69 97.42 93.61 92.29 90.52 89.77 88.24 88.08 94.19 99.04 105.96 105.42 108.58 110.7 103.37 101.75 105.27 97.63 95.09 94.36 101.12 103.72 105.68 100.32 97.68 97.57 96.74 101.93 110.44 109.82 114.64 112.57 113.22 107.49 110.17 111.48 186.6 188.3 191.5 191.18 199.18 199.42 198.43 195.97 203.19 206.09 211.02 219.31 218.63 221.76 224.89 225.23 230.98 231.65 235.15 241.89 249.28 251.02 266.53 256.84 248.8 251.09 257.19 257.51 268.25 276.81 277.21 259.22 264.03 239.38 260.06 268.49 40 2/1/19 41 3/1/19 42 4/1/19 43 5/1/19 44 6/1/19 45 7/1/19 46 8/1/19 47 9/1/19 48 10/1/19 49 11/1/19 50 12/1/19 51 1/1/20 52 2/1/20 53 3/1/20 54 4/1/20 55 5/1/20 56 6/1/20 57 7/1/20 58 8/1/20 59 9/1/20 60 10/1/20 61 11/1/20 62 12/1/20 63 1/1/21 64 2/1/21 65 66 St. Dev. Netflix 67 St. Dev. Disney 68 St. Dev. S&P 500 69 Corr Netflix/S&P 70 Corr Disney/S&P 71 Beta Netflix 72 Beta Disney 358.1 356.56 370.54 343.28 367.32 322.99 293.75 267.62 287.41 314.66 323.57 345.09 369.03 375.5 419.85 419.73 455.04 488.88 529.56 500.03 475.74 490.7 540.73 532.39 538.85 111.48 109.69 135.32 130.45 137.95 141.28 136.44 129.54 129.15 150.68 143.77 138.31 117.65 96.6 108.15 117.3 111.51 116.94 131.87 124.08 121.25 148.01 181.18 168.17 189.04 268.49 272.15 284.51 266.37 283.53 289.21 284.37 288.57 296.31 307.04 314.41 315.83 290.83 253.02 286.83 300.5 304.49 323.84 346.44 332.14 325.15 360.52 372.29 370.07 380.36 Procedure 1) Open file in Excel. 2) Calculate the returns for Netflix, Disney, and the S&P 500. The formula for percentage change is (This Month - Last MonthyLast Month. For example, assuming the stock price is in column B and row 2 contains your first observed price, the formula for C3 should be =b3/b2 - 1. Note that you will not have a return for the first month as you don't have a price for Last Month. Once you enter the formula for the first return (cell C3 in the example below), you do not have to retype it for each cell. Instead copy and paste down the column. Then, copy the entire column and paste it under Disney and the S&P 500 (start pasting at E3 and G3 in the example below). The formula will automatically update itself for each cell. 3) Once you have calculated the % Returns for each day, you must calculate the standard deviation of Netflix % Return, the standard deviation of Disney's % Return and the standard deviation of the S&P 500% Return. Then, you must calculate the correlation between Netflix and the S&P 500 and the correlation between Disney and the S&P 500. Make sure you use the % Return columns and NOT the Price columns. A) Click on the cell to the right of St. Dev. Netflix. Then, click on the insert function () from the toolbar. When you click on it, it will open a dialog box. Select Statistical. This will allow you to choose from a number of statistical formulas. Scroll down the list of selections until you get STDEV.S (in the function name window of the dialog box - this is STDEV if you are using an earlier version of Excel). Highlight STDEV.S and select OK. Now, highlight the entire column of % Return for Netflix (in our example below -- C3 through C64). Then click on OK. B) Repeat A for the St. Deviation of Disney and S&P 500. C) Click on the cell to the right of Correlation Netflix/S&P. Then, click on the insert function. Select Statistical and choose CORREL. Highlight the % Return column for Netflix in the box labeled Array 1 (C3 through C64). Tab down to Array 2 and highlight the % Return column for the S&P 500 (G3 through G64). Click on OK. D) Repeat C to calculate the correlation between Disney/S&P Calculate beta for each stock. Remember that Beta is equal to (St. Dev. Stock)(Correlation)(St. Dev. S&P) 4) B Netflix % Return D Disney E % Return G % Return 1 Date F S&P 500 ETF 184.01 175.89 175.74 2 3 4 12/1/2015 1/1/2016 2/1/2016 114.38 91.84 93.41 -19.71% 1.71% 98.51 90.40 90.12 -8.23% -0.31% -4.41% -0.09% 2/28/2021 538.85 1.21% 189.04 12.41% 380.36 2.78% 64 65 66 67 68 69 70 71 72 St. Dev. Netflix St. Dev. Disney St. Dev. S&P 500 Corr Netflix/S&P Corr Disney/S&P Beta Netflix Beta Disney *Hint: Make sure you put all your formulas for calculating standard deviations, correlations, and betas in column B as the spreadsheet is preformatted to display percentages or numbers already in these cells (B66-B72). Also, use Excel to calculate beta. Don't just take the standard deviations and correlations, punch them into your calculator and then type your answers into the beta cells (B71 and B72). Make sure that the file you submit has formulas and not just numbers in the cells. **The S&P 500 Exchange Traded Fund is used for the market instead of the S&P 500 index. The reason for this is that the index itself does not take into account dividends, so the ETF is a better measure of the returns to the market. The values for Netflix and Disney are adjusted for dividends and splits, so also better capture the real returns to investors holding these stocks. 1 % Return % Return % Return 2 3 SP 500 EIF 184.01 175.89 175.74 4 5 6 7 8 9 10 11 12 13 14 15 16 17 18 19 20 21 22 23 24 25 26 27 28 29 30 31 32 33 34 35 36 37 38 39 40 Date 12/1/15 1/1/16 2/1/16 3/1/16 4/1/16 5/1/16 6/1/16 7/1/16 8/1/16 9/1/16 10/1/16 11/1/16 12/1/16 1/1/17 2/1/17 3/1/17 4/1/17 5/1/17 6/1/17 7/1/17 8/1/17 9/1/17 10/1/17 11/1/17 12/1/17 1/1/18 2/1/18 3/1/18 4/1/18 5/1/18 6/1/18 7/1/18 8/1/18 9/1/18 10/1/18 11/1/18 12/1/18 1/1/19 2/1/19 Netflix 114.38 91.84 93.41 102.23 90.03 102.57 91.48 91.25 97.45 98.55 124.87 117 123.8 140.71 142.13 147.81 152.2 163.07 149.41 181.66 174.71 181.35 196.43 187.58 191.96 270.3 291.38 295.35 312.46 351.6 391.43 337.45 367.68 374.13 301.78 286.13 267.66 339.5 358.1 Disney 98.51 90.4 90.12 93.69 97.42 93.61 92.29 90.52 89.77 88.24 88.08 94.19 99.04 105.96 105.42 108.58 110.7 103.37 101.75 105.27 97.63 95.09 94.36 101.12 103.72 105.68 100.32 97.68 97.57 96.74 101.93 110.44 109.82 114.64 112.57 113.22 107.49 110.17 111.48 186.6 188.3 191.5 191.18 199.18 199.42 198.43 195.97 203.19 206.09 211.02 219.31 218.63 221.76 224.89 225.23 230.98 231.65 235.15 241.89 249.28 251.02 266.53 256.84 248.8 251.09 257.19 257.51 268.25 276.81 277.21 259.22 264.03 239.38 260.06 268.49 40 2/1/19 41 3/1/19 42 4/1/19 43 5/1/19 44 6/1/19 45 7/1/19 46 8/1/19 47 9/1/19 48 10/1/19 49 11/1/19 50 12/1/19 51 1/1/20 52 2/1/20 53 3/1/20 54 4/1/20 55 5/1/20 56 6/1/20 57 7/1/20 58 8/1/20 59 9/1/20 60 10/1/20 61 11/1/20 62 12/1/20 63 1/1/21 64 2/1/21 65 66 St. Dev. Netflix 67 St. Dev. Disney 68 St. Dev. S&P 500 69 Corr Netflix/S&P 70 Corr Disney/S&P 71 Beta Netflix 72 Beta Disney 358.1 356.56 370.54 343.28 367.32 322.99 293.75 267.62 287.41 314.66 323.57 345.09 369.03 375.5 419.85 419.73 455.04 488.88 529.56 500.03 475.74 490.7 540.73 532.39 538.85 111.48 109.69 135.32 130.45 137.95 141.28 136.44 129.54 129.15 150.68 143.77 138.31 117.65 96.6 108.15 117.3 111.51 116.94 131.87 124.08 121.25 148.01 181.18 168.17 189.04 268.49 272.15 284.51 266.37 283.53 289.21 284.37 288.57 296.31 307.04 314.41 315.83 290.83 253.02 286.83 300.5 304.49 323.84 346.44 332.14 325.15 360.52 372.29 370.07 380.36
Step by Step Solution
There are 3 Steps involved in it

Get step-by-step solutions from verified subject matter experts