

Question: Process Analysis Following the guidelines provided below*, conduct a quantitative analysis of the restaurant operation to identify the bottleneck in the process and to calculate
Process Analysis
- Following the guidelines provided below*, conduct a quantitative analysis of the restaurant operation to identify the bottleneck in the process and to calculate how long customers might have to wait to be served.
- Explain how the unusual seating policy is an operations management tool.
(300-500 words)
Cycle Times, Bottleneck Identification & Flow Rate
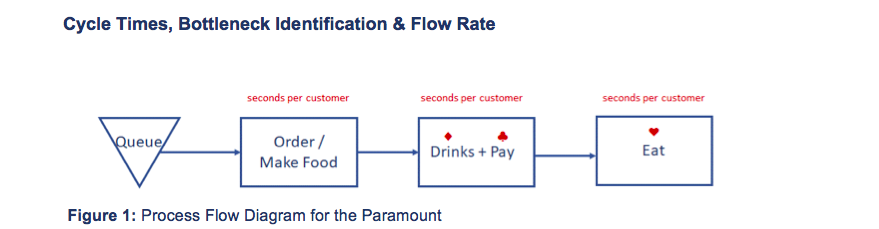
Figure 1: Process Flow Diagram for the Paramount
* Using the Process Flow Diagram in Figure 1 and the information on page 3 of the case, you should calculate the processing time for each of the three steps in seconds per customer
Note that there are two employees fulfilling drinks; you are told how many seconds that one employee can fulfil a drinks order.
Note that there are 2.6 customers per party; you are told how many seconds that the one employee taking payments can process per party. Youll have to convert this to per customer.
You are told on page 3 how long in minutes that every table turns over.
You need to convert this table turnover time to seconds and then divide by the number of seats in the restaurant to calculate the seconds per customer. However, you should assume only 80% of the seats are occupied by customers at any time. Therefore, make sure to multiply the seat number by 0.8 before completing the calculation.
- You should now be able to identify the bottleneck step in seconds per customer; this is the cycle time of the process.
To convert cycle time into the Flow Rate that customers flow through the restaurant, use the formula 1 / cycle-time. This will tell you how many customers per second are processed. Remember to multiply this by 3600 to convert the Flow Rate units into customers per hour. This Flow Rate in customers per hour can be used as the value of (service rate) for the equations in Exhibit 8 of the case study.
Customer Arrival Rates
Waiting time formulae are provided in Exhibit 8 of the case study.
Use Exhibit 6 to analyse the rate per hour that customers arrive. You should focus on the Saturday data as this is the restaurants busiest day. To start you off: between 7:30am and 8:30am, 35+45 = 80 customers arrive. You can calculate the number of customers per hour for each of the hours up to 1:30pm.
Use Exhibit 7 on Customer Balking and Reneging to adjust your customer arrival rates. To start you off: between 7:30am and 8:30am, 15 customers either balk or renege. This means that between 7:30am and 8:30am, 80 customers arriving 15 customers balking or reneging = a net 65 customers per hour arriving. You can similarly adjust your calculations above for each of the hours up to 1:30pm. You could use a table like that in Table 1 below.
Table 1: Customers per hour arriving on Saturday
Hour SlotNumber of customers arriving per hour from Exhibit 6Number of customers balking or reneging per hour from Exhibit 7Net number of customers arriving per hourAdjust to nearest whole number
e.g. 72 goes to 70
e.g. 77 goes to 80 etc.
7:30am 8:30am35 + 45 = 801565658:30am 9:30am35 + 42 = 774 + 12 = 1661609:30am 10:30am 10:30am 11:30am 11:30am 12:30pm 12:30pm 1:30pm
Once you have completed a similar table for yourselves, choose the highest net customers arriving per hour value (Table 1, column 5) for the calculations below.
This value can be used as the value of (customer arrival rate) for the equations in Exhibit 8 of the case study.
Worker Utilization
The Utilization equation is given in Exhibit 8 of the case study: Lq 2 / (1 -
You can calculate Worker Utilization as you have already worked out and above.
Average Number of Customers Waiting for the Restaurant in a Queue
The equation for the average number of customers waiting for service (waiting in a queue) is given in Exhibit 8 of the case study: Lq 2 / (1 -
- Once you have calculated Lq, multiply this by 1.5 minutes per customer (based on 90 customers per hour) to calculate how many minutes the wait will be for each customer.
- We are told on page 2 of the case study that the restaurant opens on a Saturday at 8:00am. Exhibit 6 tells us that there are 35 customers in the queue on a Saturday morning before the restaurant opens. Therefore, you need to add this 35 to the Lq value above and multiply this by 1.5 minutes per customer (based on 90 customers per hour) to calculate how many minutes the wait really will be for each customer on a Saturday
Restaurant Customer Queue Length when Carryout Orders are Being Processed
If the Paramount can process 90 customers per hour, lets assume that Michael Conlon allows 10% of the customer orders to be carryout orders. This would mean that 9 customer orders per hour were for carryout food and 81 customers per hour could be processed in the restaurant.
- Use 81 as the value of (service rate) and recalculate worker utilization
- Use this new value of to recalculate the number of customers waiting in the queue Lq
This will give you a good insight into the impact that accepting more carryout orders would have on queues at the restaurant.
Cycle Times, Bottleneck Identification \& Flow Rate Figure 1: Process Flow Diagram for the Paramount
Step by Step Solution
There are 3 Steps involved in it

Get step-by-step solutions from verified subject matter experts