

Question: Process - at - a - Glance ( PaaG ) Charts were developed as part of 3 P ( Production Preparation Process, created by Chihiro
ProcessataGlance PaaG Charts were developed as part of P Production Preparation Process, created by Chihiro Nakao at Toyota Motor Corporation to visually describe manufacturing processes and to evaluate multiple alternative combinations of process, methods, tools, etc., prior to production. The objective is to design quality into the process by reversing how one creates a production process:
From: Machines Equipment, Tooling, Layout Flow Expensive, Poor Quality, Long LeadTime
To: Process Flow, Tooling, Machines Low Cost, High Quality, ShortLeadTime
You are expected to apply this method as an analog to the methods that the authors of The Lean Turnaround present to transform an organization from batchandqueue material and information processing conventional management to flow TPSLean management
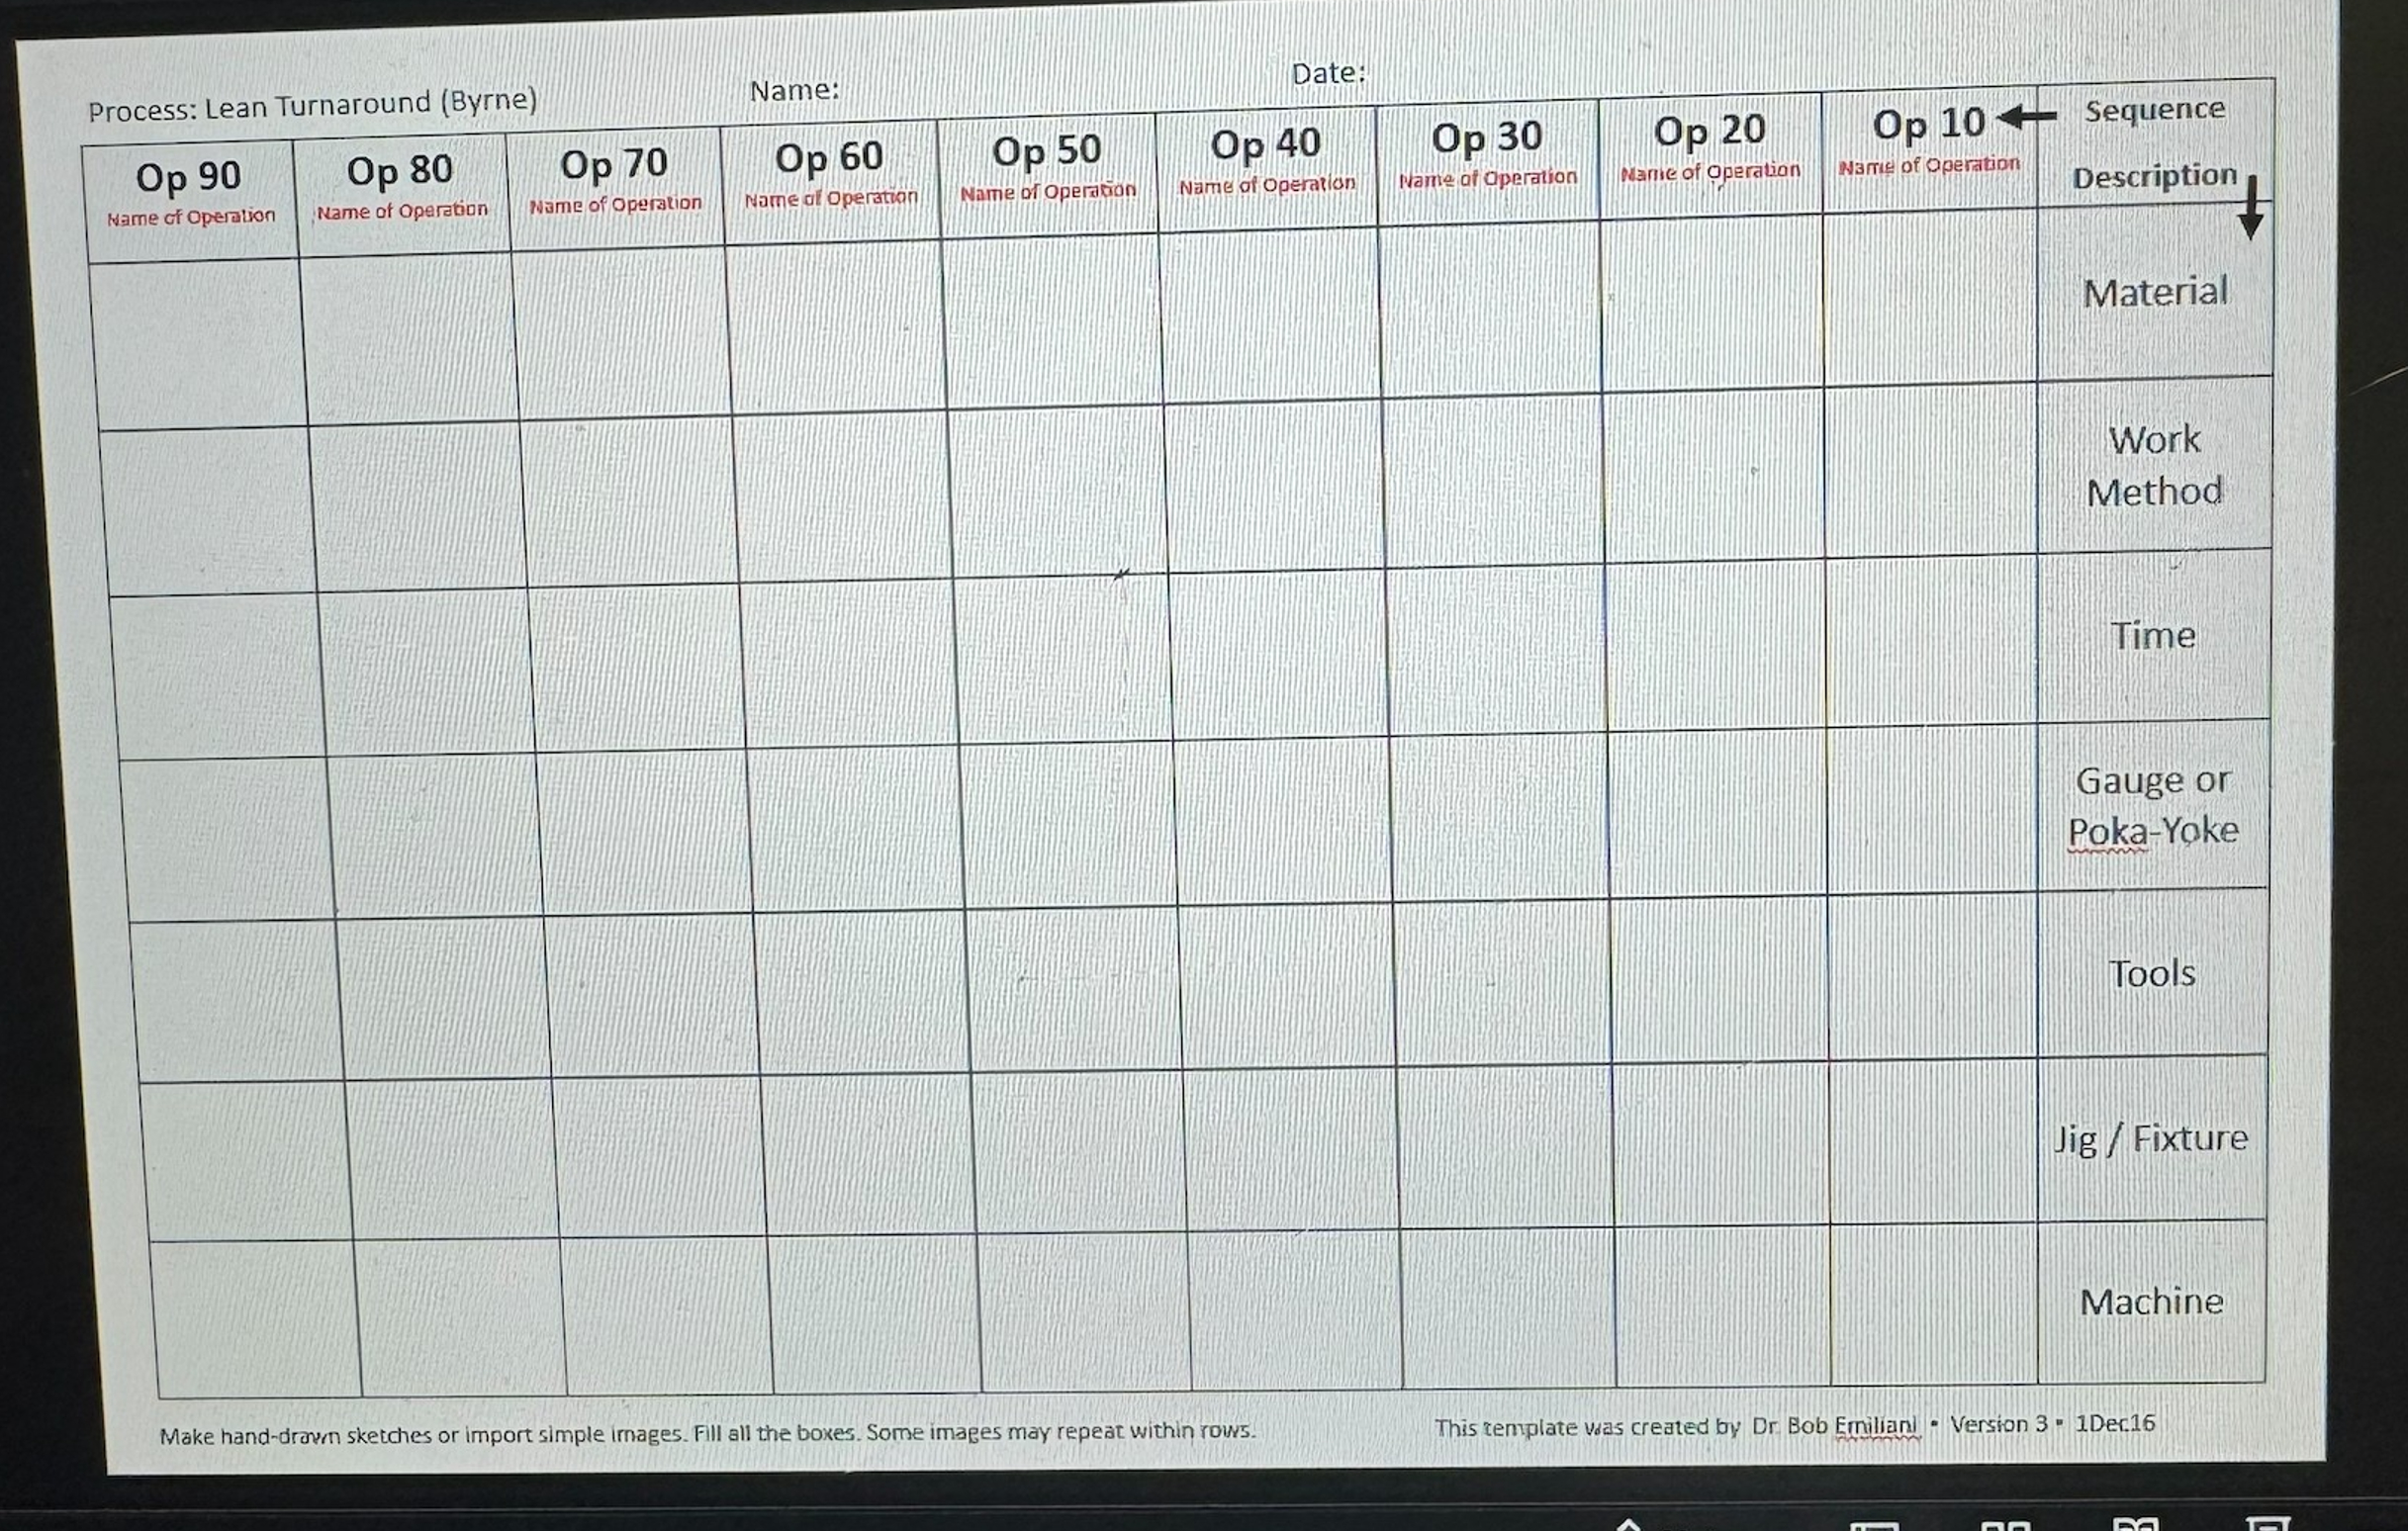
THINK: In the context of leadership, management, and transforming a business from batchandqueue material and information processing to flow Lean transformation what does each of the following mean? It will help if you write down examples of each.
Material What is material? What material is needed?
Work Method What is a work method? What work methods should leadership use?
Time What time is associated with each work method?
Gauge or PokaYoke How do you quickly measure progress and in what simple ways can you mistakeproof a process?
Tools What are tools? What tools are needed.
Jig Fixture What are jigs and fixtures? What jigs and fixtures are needed?
Machine What is a machine? What machines are needed?
PaaG Charts are percent images and percent words. You can start with words but convert most of the words to images. Look for examples from nature. This is your first choice. Second choice is to look for examples from the emoticons on your cellphone. Think of other sources of images that you can draw upon to clearly describe things. Sketching is preferable to graphic images. Use black of blue ink when sketching. Do not use pencil in your submission.
Use resources on the Internet or elsewhere to learn more about P and PaaG charts.
Step by Step Solution
There are 3 Steps involved in it
1 Expert Approved Answer
Step: 1 Unlock

Question Has Been Solved by an Expert!
Get step-by-step solutions from verified subject matter experts
Step: 2 Unlock
Step: 3 Unlock