

Question: process strategy solve the following process strategy and plot the graph ollowing production cost data and the price forecast: a) On the same chart (on
process strategy 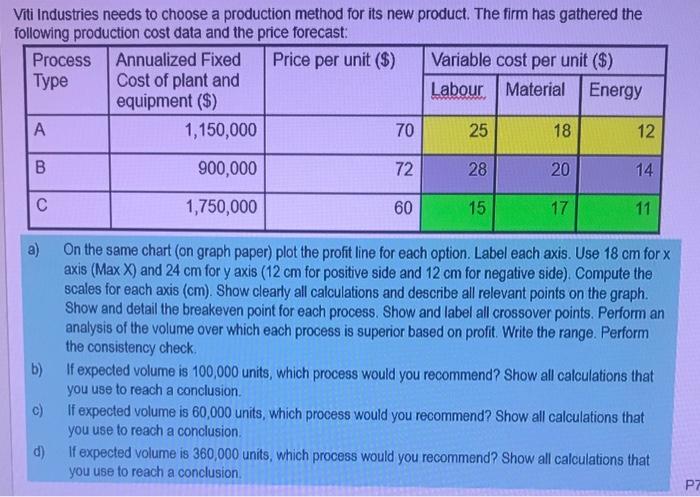
solve the following process strategy and plot the graph
ollowing production cost data and the price forecast: a) On the same chart (on graph paper) plot the profit line for each option. Label each axis. Use 18cm for x axis (Max X) and 24cm for y axis ( 12cm for positive side and 12cm for negative side). Compute the scales for each axis (cm). Show clearly all calculations and describe all relevant points on the graph. Show and detail the breakeven point for each process. Show and label all crossover points. Perform an analysis of the volume over which each process is superior based on profit. Write the range. Perform the consistency check: b) If expected volume is 100,000 units, which process would you recommend? Show all calculations that you use to reach a conclusion. c) If expected volume is 60,000 units, which process would you recommend? Show all calculations that you use to reach a conclusion. d) If expected volume is 360,000 units, which process would you recommend? Show all calculations that you use to reach a conclusion. ollowing production cost data and the price forecast: a) On the same chart (on graph paper) plot the profit line for each option. Label each axis. Use 18cm for x axis (Max X) and 24cm for y axis ( 12cm for positive side and 12cm for negative side). Compute the scales for each axis (cm). Show clearly all calculations and describe all relevant points on the graph. Show and detail the breakeven point for each process. Show and label all crossover points. Perform an analysis of the volume over which each process is superior based on profit. Write the range. Perform the consistency check: b) If expected volume is 100,000 units, which process would you recommend? Show all calculations that you use to reach a conclusion. c) If expected volume is 60,000 units, which process would you recommend? Show all calculations that you use to reach a conclusion. d) If expected volume is 360,000 units, which process would you recommend? Show all calculations that you use to reach a conclusion
Step by Step Solution
There are 3 Steps involved in it
1 Expert Approved Answer
Step: 1 Unlock

Question Has Been Solved by an Expert!
Get step-by-step solutions from verified subject matter experts
Step: 2 Unlock
Step: 3 Unlock