

Question: Process time at a workstation is monitored using sample mean and range control charts. Six samples of n = 11 observations have been obtained

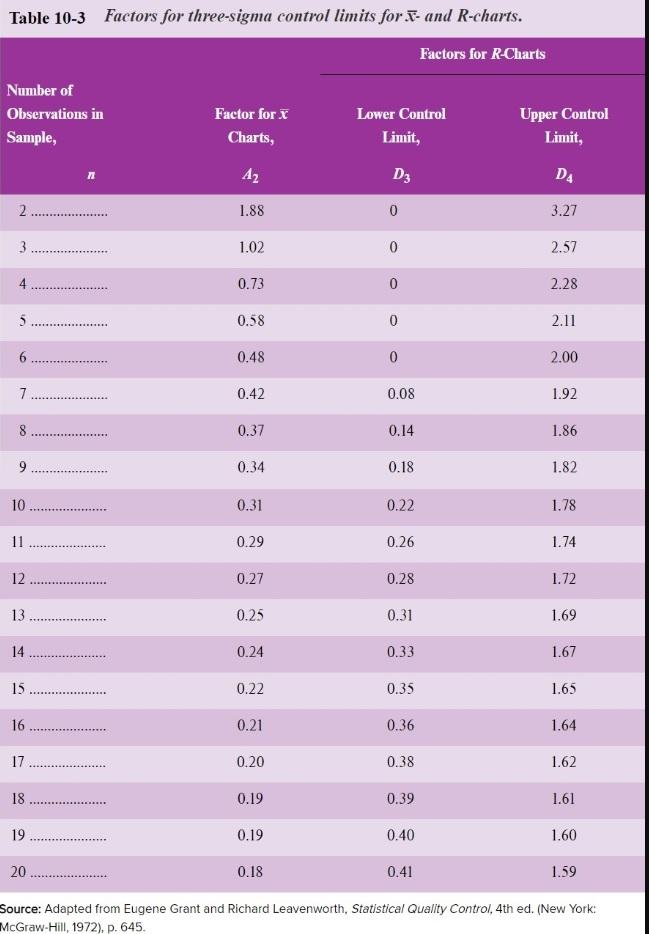
Process time at a workstation is monitored using sample mean and range control charts. Six samples of n = 11 observations have been obtained and the sample means and ranges computed (in minutes): Sample 1 2 3 4 5 6 Mean Range Mean 3.07 3.14 3.15 3.26 3.19 3.05 a. Using the factors in Table 10-3, determine the upper and lower limits for sample mean and range control charts. (Round the intermediate calculations to 2 decimal places. Round the final mean answers to 2 decimal places. Round the final range answers to 3 decimal places.) O Yes O No UCL b. Is the process in control? Range 0.48 0.51 0.45 0.47 0.54 0.49 LCL
Step by Step Solution
3.33 Rating (153 Votes )
There are 3 Steps involved in it
Solution To determine the upper and lower control limits for the sample mean and range control chart... View full answer

Get step-by-step solutions from verified subject matter experts