

Question: Prof. Eggleston, always interested in improving her teaching effectiveness, has decided to undertake a careful analysis of her evaluations from the past three years.
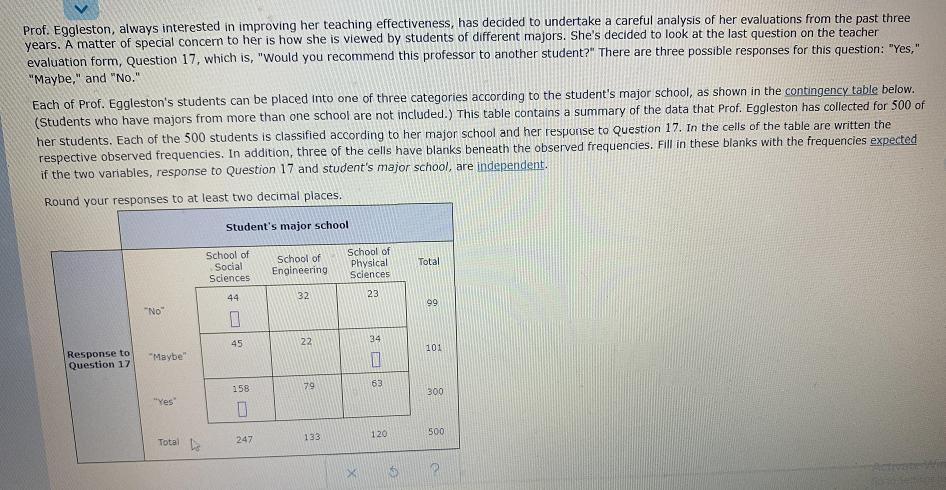
Prof. Eggleston, always interested in improving her teaching effectiveness, has decided to undertake a careful analysis of her evaluations from the past three years. A matter of special concern to her is how she is viewed by students of different majors. She's decided to look at the last question on the teacher evaluation form, Question 17, which is, "Would you recommend this professor to another student?" There are three possible responses for this question: "Yes," "Maybe," and "No." Each of Prof. Eggleston's students can be placed into one of three categories according to the student's major school, as shown in the contingency table below. (Students who have majors from more than one school are not included.) This table contains a summary of the data that Prof. Eggleston has collected for 500 of her students. Each of the 500 students is classified according to her major school and her response to Question 17. In the cells of the table are written the respective observed frequencies. In addition, three of the cells have blanks beneath the observed frequencies. Fill in these blanks with the frequencies expected if the two variables, response to Question 17 and student's major school, are independent. Round your responses to at least two decimal places. Student's major school School of Social Sciences School of Engineering. School of Physical Sciences Total 44 32 23 99 "No 101 Response to Question 17. 300 500 ivated Afr "Maybe" "Yes" Total s D 45 158 0 247 22 79 133 X 34 1 63 120 5 e
Step by Step Solution
3.38 Rating (145 Votes )
There are 3 Steps involved in it
Formula E F row totalcolumn total... View full answer

Get step-by-step solutions from verified subject matter experts