

Question: Profit-Volume Graph: Identification and Sensitivity Analysis A typical profit-volume graph follows. A F B E D Required a. Identify each of the following: 1. Area
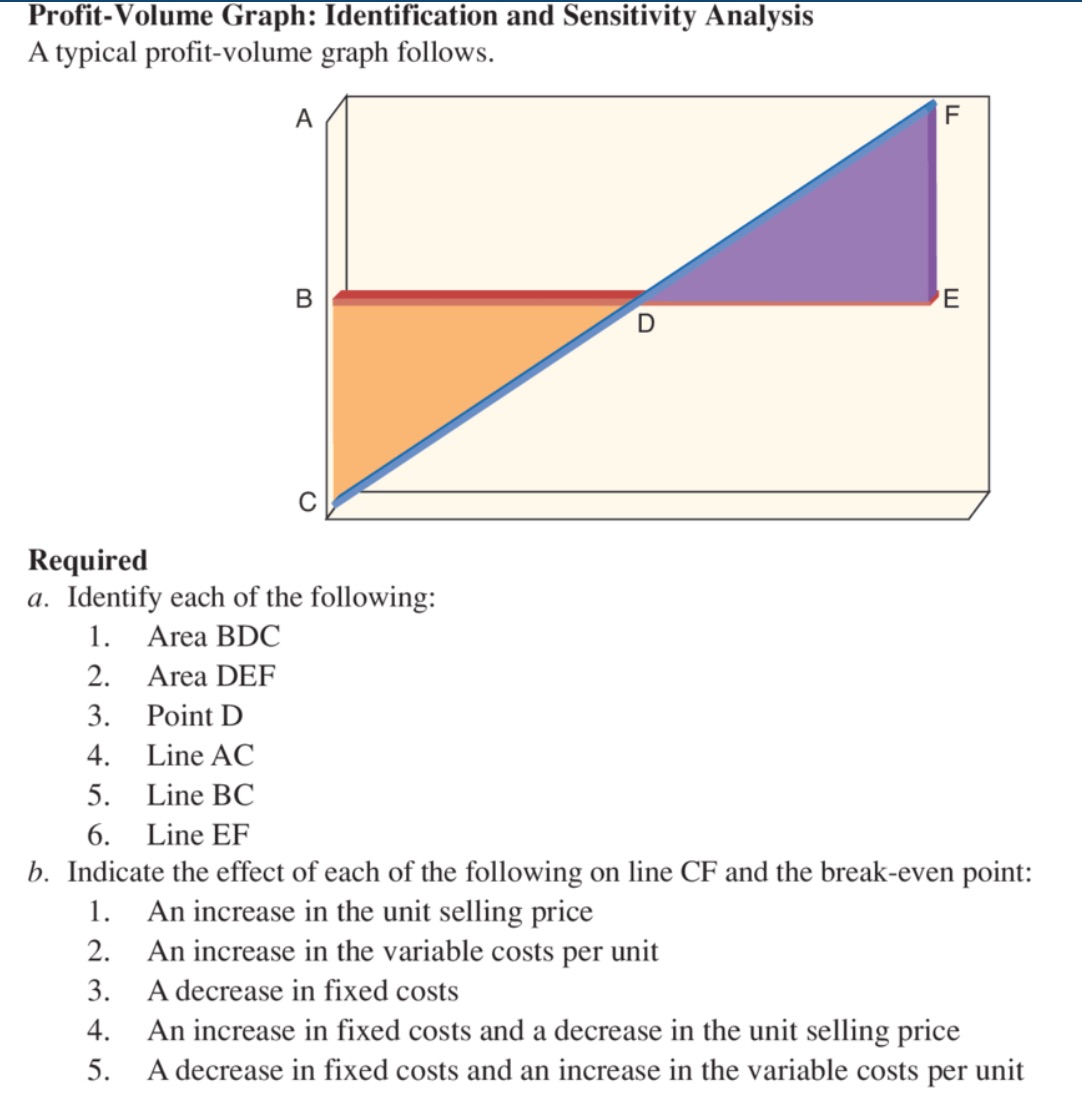
Profit-Volume Graph: Identification and Sensitivity Analysis A typical profit-volume graph follows. A F B E D Required a. Identify each of the following: 1. Area BDC 2. Area DEF 3. Point D 4. Line AC 5. Line BC 6. Line EF b. Indicate the effect of each of the following on line CF and the break-even point: 1. An increase in the unit selling price 2. An increase in the variable costs per unit 3. A decrease in fixed costs 4. An increase in fixed costs and a decrease in the unit selling price 5. A decrease in fixed costs and an increase in the variable costs per unit
Step by Step Solution
There are 3 Steps involved in it
1 Expert Approved Answer
Step: 1 Unlock

Question Has Been Solved by an Expert!
Get step-by-step solutions from verified subject matter experts
Step: 2 Unlock
Step: 3 Unlock