

Question: Program in Python, graphing http://www.cse.msu.edu/~cse231/Online/Labs/Lab15/ here is the link to all the files. thanks Lab Exercise #15 Assignment overview This lab exercise provides practice with
Program in Python, graphing
http://www.cse.msu.edu/~cse231/Online/Labs/Lab15/
here is the link to all the files. thanks
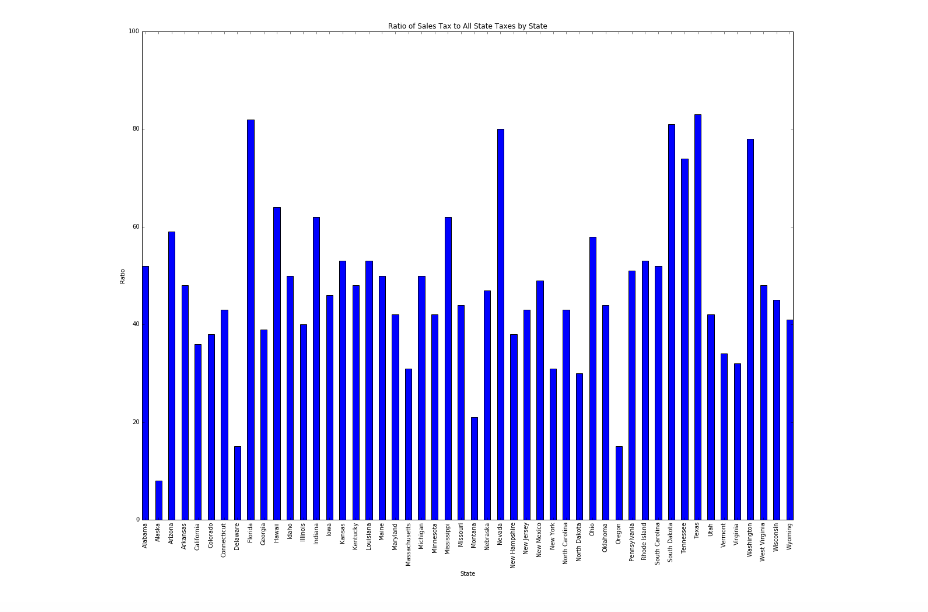
Lab Exercise #15 Assignment overview This lab exercise provides practice with plotting in Python. Bar Graph We provide a comma-separated-value file, STC 2014 STC005 csv. of tax data from the US Census Bureau: http://www.census.gov/govs/statetax/ We are interested in three columns: state name (at index 2), Total Taxes (at index 3), and Sales and Gross Receipts Taxes (at index 5). There are some header lines to ignore, but the data columns are clean (no missing or weird characters). For each state (i.e. each row) calculate the percent of Total Taxes that are Sales and Gross Receipts Taxes, ie. values at index 5 over values at index 3. Note that the states are already in alphabetical order (hint: that should guide your choice of data structure). Write a program that reads that csv file and plots these values as a bar graph with states on the x-axis and percent on the y-axis. Your task is to make a bar graph that looks like this
Step by Step Solution
There are 3 Steps involved in it

Get step-by-step solutions from verified subject matter experts