

Question: Programming Problems 6 and 7 (except 7a.) on Page 413-414. Remember that Section 13.4 provides details of how to implement simulations. Altogether, there should be
Programming Problems 6 and 7 (except 7a.) on Page 413-414. Remember that Section 13.4 provides details of how to implement simulations.
Altogether, there should be 3 variations of the bank simulation:
- Single queue for one teller - Three queue for three tellers (events take turn in the order of arrival or enter the shortest line) - Single queue for three tellers
Randomly generate 100 events with a random start time within the range from 1 to 540 and a duration in the range of 1 to 20 to be used as the input to the simulation. Note that the input file should be the same when different queue methods are compared. Create 5 sets of input data and run all 3 variations of the simulation on each set.
You should first generate the random values for event start time, and then sort them. Then, for each start time you can assign your randomly generated values for event duration. These values should be written into a file that will be later read by simulator.
Deliverables:
Randomly generated input files Source code for your classes A main file that tests the classes with randomly generated data Output of your code, formatted as described in the book, plus the additional statistics in part 7b. Table including your comparisons of each simulation for each data set.
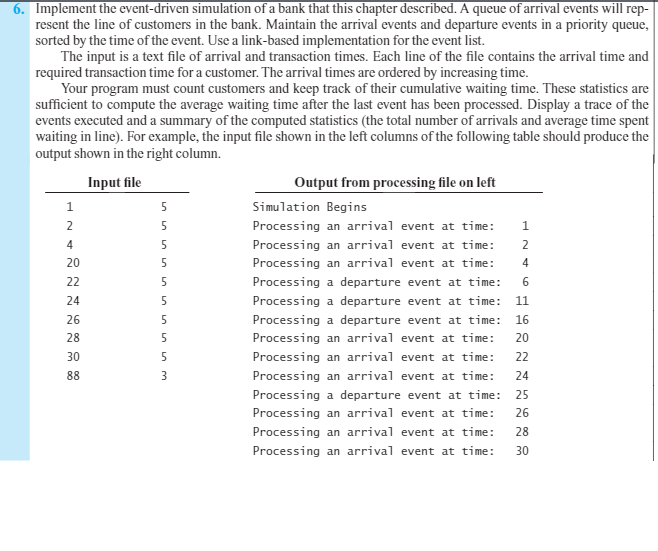
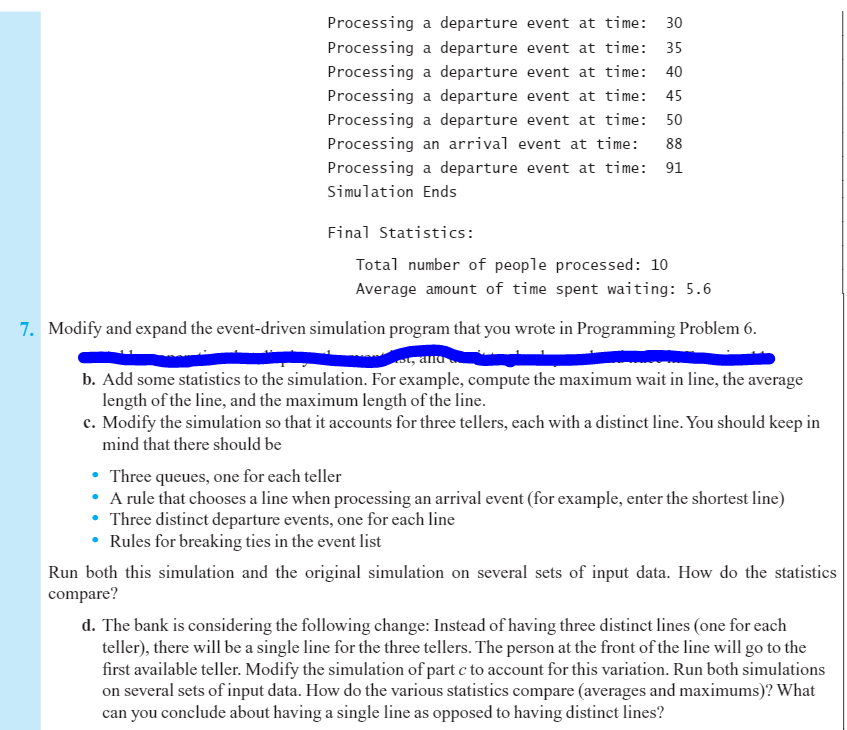
6. Implement the event-driven simulation of a bank that this chapter described. A queue ofarrival events will rep- resent the line of customers in the bank. Maintain the arrival events and departure events in a priority queue, sorted by the time oftheevent. Use a link-based implementation for the event list. The input is a text file of arrival and transaction times. Each line of the file contains the arrival time and required transaction time for a customer. The arrival times are ordered by increasing time. Your program must count customers and keep track of their cumulative waiting time. These statistics are sufficient to compute the average waiting time after the last event has been processed. Display a trace of the events executed and a summary of the computed statistics (the total number of arrivals and average time spent waiting in line). For example, the input file shown in the left columns ofthe following table should produce the output shown in the right column Input file Output from processing file on left Simulation Begins Processing an arrival event at time 1 Processing an arrival event at time: 2 Processing an arrival event at time: 4 20 Processing a departure event at time: 6 22 24 Processing a departure event at time: 11 Processing a departure event at time: 16 26 Processing an arrival event at time: 20 28 Processing an arrival event at time: 22 30 Processing an arrival event at time: 24 88 Processing a departure event at time: 25 Processing an arrival event at time 26 Processing an arrival event at time: 28 Processing an arrival event at time 30
Step by Step Solution
There are 3 Steps involved in it

Get step-by-step solutions from verified subject matter experts