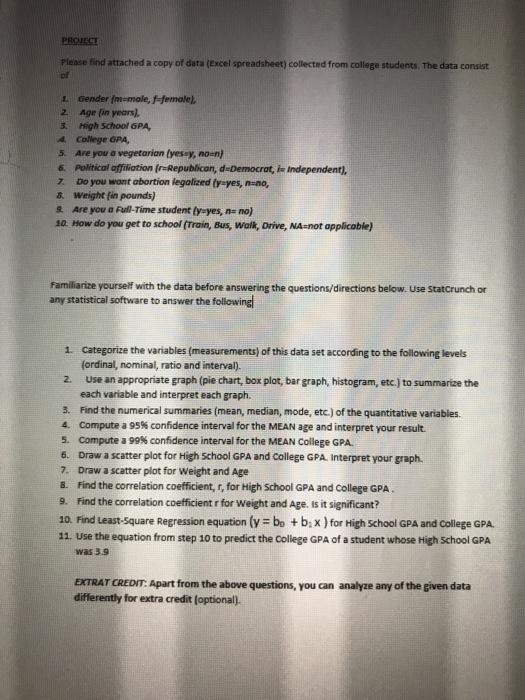
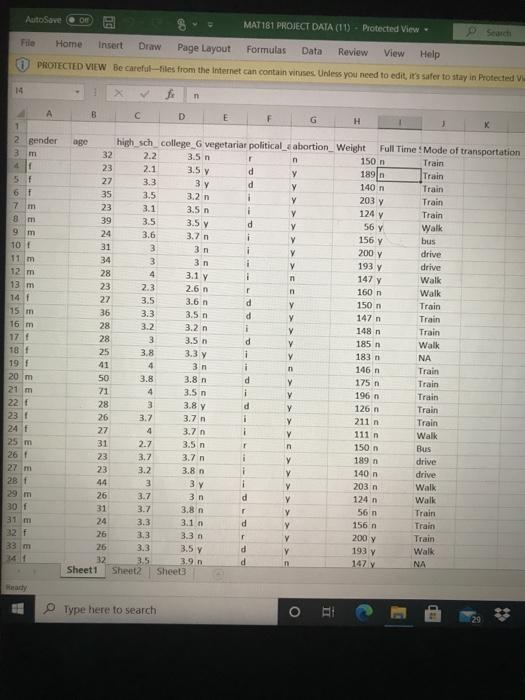
Question: PROIECT Please find attached a copy of data (Excel spreadsheet) collected from college students. The data consist 1 Gender ( nmole, fefemale), 2 Age in
PROIECT Please find attached a copy of data (Excel spreadsheet) collected from college students. The data consist 1 Gender ( nmole, fefemale), 2 Age in years 3. Migh School GPA, 4 College GPA 5. Are you a vegetarian (yes, noen) 6. Political affiliation fr-Republican, d-Democrat, la Independent), Do you want abortion legalized fyayes, no 8. Weight fin pounds) 9. Are you a full-Time studently yes, nano) 10. How do you get to school (Train, Bus, Walk, Drive, NA=not applicable) Familiarize yourself with the data before answering the questions/directions below. Use StatCrunch or any statistical software to answer the following 2 1. Categorize the variables (measurements) of this data set according to the following levels (ordinal, nominal, ratio and interval). Use an appropriate graph (pie chart, box plot, bar graph, histogram, etc.) to summarize the each variable and interpret each graph. 3. Find the numerical summaries (mean, median, mode, etc.) of the quantitative variables. 4. Compute a 95% confidence interval for the MEAN age and interpret your result. 5. Compute a 99% confidence interval for the MEAN College GPA. 6. Draw a scatter plot for High School GPA and College GPA. Interpret your graph. 7. Draw a scatter plot for weight and Age &. Find the correlation coefficient, r, for High School GPA and College GPA. 9. Find the correlation coefficient for weight and Age. Is it significant? 10. Find Least-Square Regression equation (y = bo + bx ) for High School GPA and College GPA. 11. Use the equation from step 10 to predict the College GPA of a student whose High School GPA was 3.9 EXTRAT CREDIT: Apart from the above questions, you can analyze any of the given data differently for extra credit (optional). AutoSave MAT181 PROJECT DATA (11) - Protected View File Home Insert Draw Page Layout Formulas Data Review View Help PROTECTED VIEW Be careful-files from the Internet can contain viruses. Unless you need to edit, it's safer to stay in Protected VI 14 B C D E F G H 1 2 gender K m 4 2.1 150 n 1891 140 203 Y 3.5 V 3.6 200 y 193 y 147 y 3.1 Y 3.5 m 150 147 n oge high sch college G vegetariar political_abortion Weight Full Time : Mode of transportation 32 2.2 3.5 m n Train 23 3.5 y d y Train 27 3.3 3 y d y Train 35 3.5 3.2 n i Y Train 23 3.1 3.5 n i 124 y Train 39 3.5 y 56 y Walk 24 3.7 m i Y 156 Y bus 31 3 3 n i Y drive 34 3 3 n i V drive 28 4 1 n Walk 23 2.3 2.6 n 160 n Walk 27 3.5 3.6 d V Train 36 3.3 d y Train 28 3.2 3.2 n 1 Y 148 n Train 28 3 3.5 n d Y 185 n Walk 25 3.8 3.3 y i Y NA 41 4 3. i 146 n Train 50 3.8 3.8 d Y 175 n Train 71 4 3.5 m i y 196 n Train 28 3 d Y 126 n Train 26 3.7 3.7 m i Y 211n Train 27 4 3.7 n 1 y 111 n Walk 31 2.7 3.5 n n Bus 23 3.7 3.7 m i 189 n drive 23 3.2 Y drive 44 3 1 Y 203 n Walk 26 3 n d Y 124 n Walk 31 3.7 Y 56 n Train 24 3.3 3.10 d Train 26 3.3 3.3 r 200 y Train 26 3.3 d Walk 32 3.5 3.9. 147 y NA Sheet1 Sheet2 Sheet 6f 7 8 m 9 m 10 11 m 12 m 13 m 14 f 15 m 16 m 17 1 18 19 20 m 21 m 22 23 24 25 m 26 27 m 281 29 m 30 31 m 32 f 33 m 34 183 n 3.8 7 150. 3.80 3 Y 140 n 3.7 3.80 156 3.5 y 193 v Ready Type here to search O PROIECT Please find attached a copy of data (Excel spreadsheet) collected from college students. The data consist 1 Gender ( nmole, fefemale), 2 Age in years 3. Migh School GPA, 4 College GPA 5. Are you a vegetarian (yes, noen) 6. Political affiliation fr-Republican, d-Democrat, la Independent), Do you want abortion legalized fyayes, no 8. Weight fin pounds) 9. Are you a full-Time studently yes, nano) 10. How do you get to school (Train, Bus, Walk, Drive, NA=not applicable) Familiarize yourself with the data before answering the questions/directions below. Use StatCrunch or any statistical software to answer the following 2 1. Categorize the variables (measurements) of this data set according to the following levels (ordinal, nominal, ratio and interval). Use an appropriate graph (pie chart, box plot, bar graph, histogram, etc.) to summarize the each variable and interpret each graph. 3. Find the numerical summaries (mean, median, mode, etc.) of the quantitative variables. 4. Compute a 95% confidence interval for the MEAN age and interpret your result. 5. Compute a 99% confidence interval for the MEAN College GPA. 6. Draw a scatter plot for High School GPA and College GPA. Interpret your graph. 7. Draw a scatter plot for weight and Age &. Find the correlation coefficient, r, for High School GPA and College GPA. 9. Find the correlation coefficient for weight and Age. Is it significant? 10. Find Least-Square Regression equation (y = bo + bx ) for High School GPA and College GPA. 11. Use the equation from step 10 to predict the College GPA of a student whose High School GPA was 3.9 EXTRAT CREDIT: Apart from the above questions, you can analyze any of the given data differently for extra credit (optional). AutoSave MAT181 PROJECT DATA (11) - Protected View File Home Insert Draw Page Layout Formulas Data Review View Help PROTECTED VIEW Be careful-files from the Internet can contain viruses. Unless you need to edit, it's safer to stay in Protected VI 14 B C D E F G H 1 2 gender K m 4 2.1 150 n 1891 140 203 Y 3.5 V 3.6 200 y 193 y 147 y 3.1 Y 3.5 m 150 147 n oge high sch college G vegetariar political_abortion Weight Full Time : Mode of transportation 32 2.2 3.5 m n Train 23 3.5 y d y Train 27 3.3 3 y d y Train 35 3.5 3.2 n i Y Train 23 3.1 3.5 n i 124 y Train 39 3.5 y 56 y Walk 24 3.7 m i Y 156 Y bus 31 3 3 n i Y drive 34 3 3 n i V drive 28 4 1 n Walk 23 2.3 2.6 n 160 n Walk 27 3.5 3.6 d V Train 36 3.3 d y Train 28 3.2 3.2 n 1 Y 148 n Train 28 3 3.5 n d Y 185 n Walk 25 3.8 3.3 y i Y NA 41 4 3. i 146 n Train 50 3.8 3.8 d Y 175 n Train 71 4 3.5 m i y 196 n Train 28 3 d Y 126 n Train 26 3.7 3.7 m i Y 211n Train 27 4 3.7 n 1 y 111 n Walk 31 2.7 3.5 n n Bus 23 3.7 3.7 m i 189 n drive 23 3.2 Y drive 44 3 1 Y 203 n Walk 26 3 n d Y 124 n Walk 31 3.7 Y 56 n Train 24 3.3 3.10 d Train 26 3.3 3.3 r 200 y Train 26 3.3 d Walk 32 3.5 3.9. 147 y NA Sheet1 Sheet2 Sheet 6f 7 8 m 9 m 10 11 m 12 m 13 m 14 f 15 m 16 m 17 1 18 19 20 m 21 m 22 23 24 25 m 26 27 m 281 29 m 30 31 m 32 f 33 m 34 183 n 3.8 7 150. 3.80 3 Y 140 n 3.7 3.80 156 3.5 y 193 v Ready Type here to search O