

Question: Project 1 and Project 2 have the cash-flows given in the table below. WACC 7.50% Project Period project 1 project 2 0 -$50.00 -$50.00 1
Project 1 and Project 2 have the cash-flows given in the table below.
| WACC | 7.50% | ||
| Project | |||
| Period | project 1 | project 2 | |
| 0 | -$50.00 | -$50.00 | |
| 1 | $10.00 | $10.00 | |
| 2 | $10.00 | $18.00 | |
| 3 | $40.00 | $20.00 | |
| 4 | $80.00 | $22.00 | |
| 5 | $25.00 | ||
| 6 | $60.00 | ||
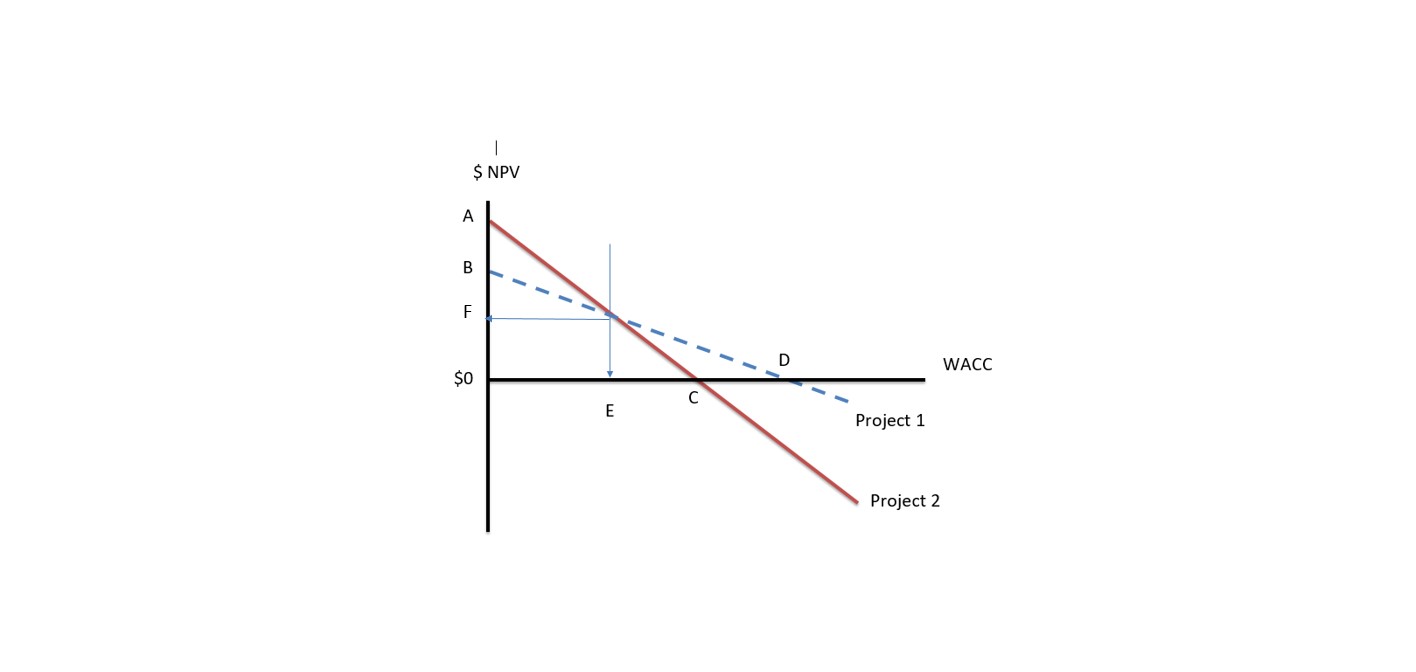
Using the data in the table and the graph, what is the value of D in the graph?
| 11.80% |
| 39.55% |
| 33.06% |
| 38.70% |
| 37.80% |
$ NPV WACC $0 Project 1 Project 2
Step by Step Solution
There are 3 Steps involved in it
1 Expert Approved Answer
Step: 1 Unlock

Question Has Been Solved by an Expert!
Get step-by-step solutions from verified subject matter experts
Step: 2 Unlock
Step: 3 Unlock