

Question: Project 1: Descriptive Statistics Worksheet Directions: Students may complete this worksheet using either SPSS or Excel. If using SPSS to complete this assignment, refer to
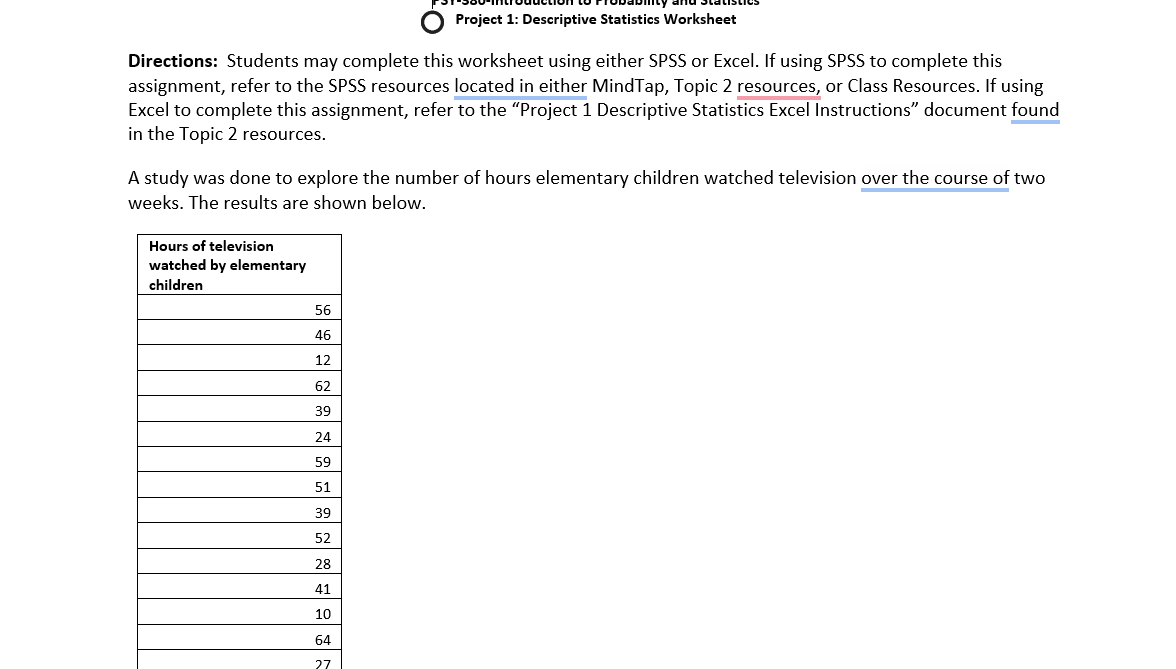
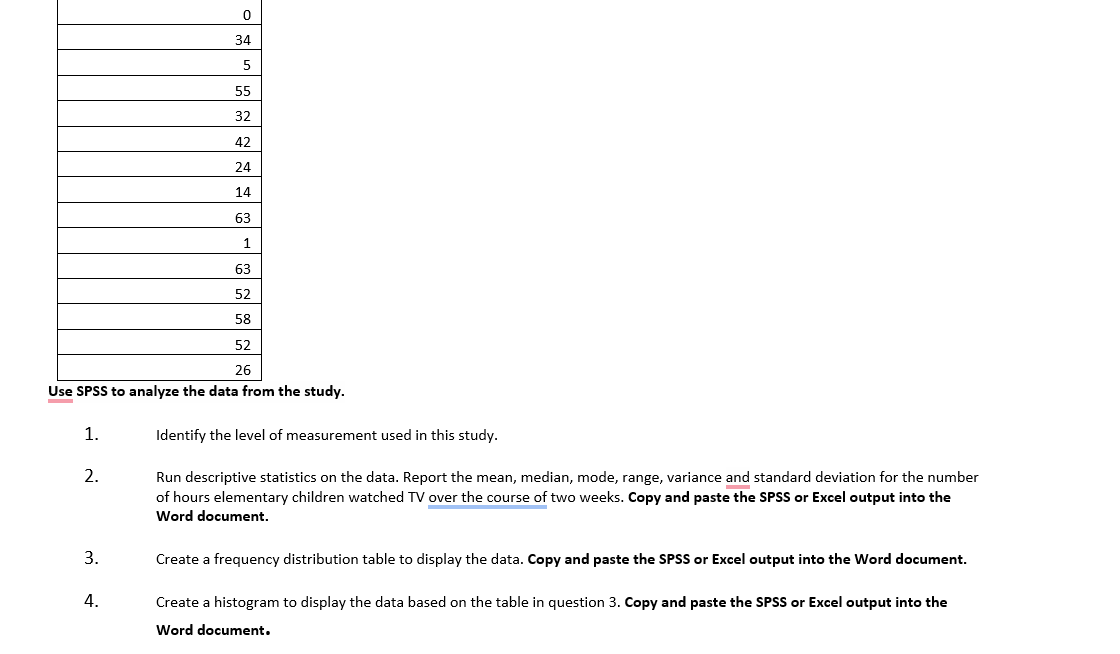
Project 1: Descriptive Statistics Worksheet Directions: Students may complete this worksheet using either SPSS or Excel. If using SPSS to complete this assignment, refer to the SPSS resources located in either MindTap, Topic 2 resources, or Class Resources. If using Excel to complete this assignment, refer to the "Project 1 Descriptive Statistics Excel Instructions" document found in the Topic 2 resources. A study was done to explore the number of hours elementary children watched television over the course of two weeks. The results are shown below. Hours of television watched by elementary children 56 46 12 62 39 24 59 51 39 52 28 41 10 64 270 34 5 55 32 42 24 14 63 1 63 52 28 52 26 Use SPSS to analyze the data from the study. 1. Identify the level of measurement used in this study. 2. Run descriptive statistics on the data. Report the mean, median, mode, range, variance and standard deviation for the number of hours elementary children watched TV over the course of two weeks. Copy and paste the SPSS or Excel output into the Word document. 3. Create a frequency distribution table to display the data. Copy and paste the SPSS or Excel output into the Word document. 4. Create a histogram to display the data based on the table in question 3. Copy and paste the SPSS or Excel output into the Word document
Step by Step Solution
There are 3 Steps involved in it

Get step-by-step solutions from verified subject matter experts