

Question: Project 1 - Parametric Equations In a web browser open up a desmos graphing window. If you haven't already, then sign up for a desmos
Project Parametric Equations
In a web browser open up a desmos graphing window. If you haven't already, then sign up for a desmos account.
Inside a desmos folder name it Parameterized Line Segment do the following tasks.
a Define and in separate cells.
b Plot the point in green and the point in red. Observe that you can drag the points wherever you like.
c Define to represent the coordinate of the line segment. Similarly, define to represent the coordinate of the line segment. Restrict the domain on both functions for Then hide both curves. Plot the parameterized line segment
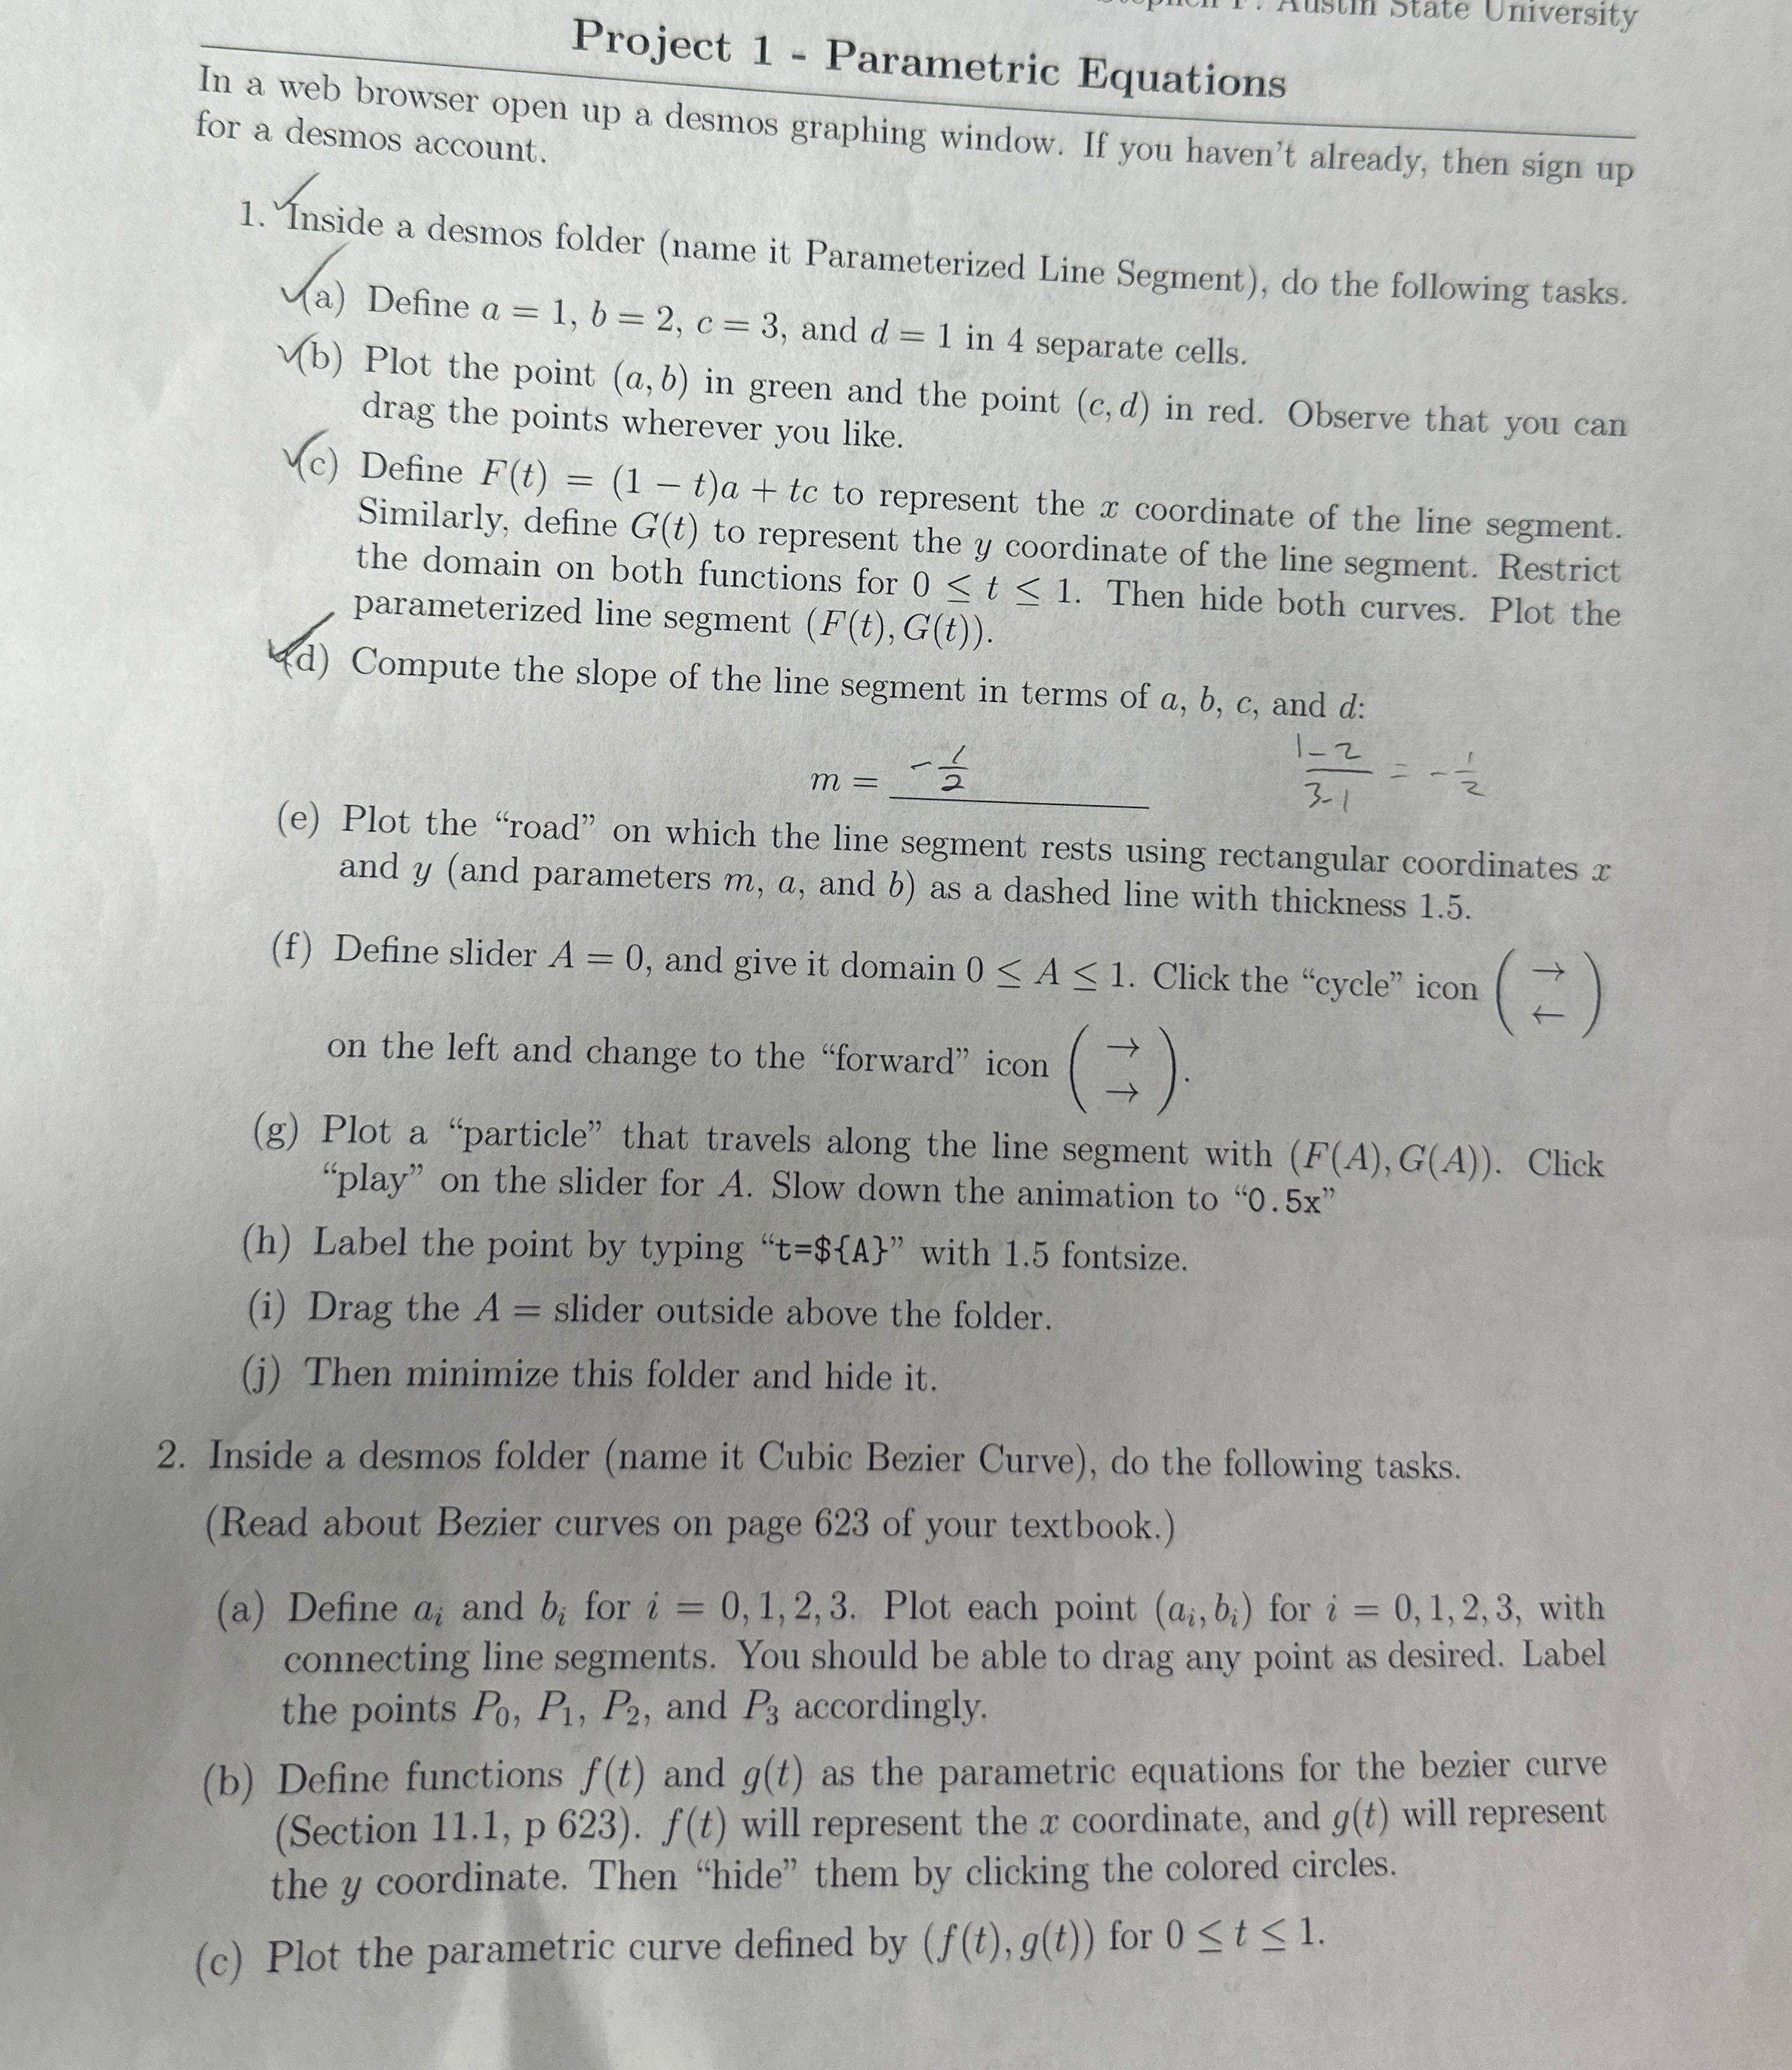
d Compute the slope of the line segment in terms of and :
e Plot the "road" on which the line segment rests using rectangular coordinates and and parameters and as a dashed line with thickness
f Define slider and give it domain Click the "cycle" icon on the left and change to the "forward" icon
g Plot a "particle" that travels along the line segment with Click "play" on the slider for Slow down the animation to
h Label the point by typing $ with fontsize.
i Drag the slider outside above the folder.
j Then minimize this folder and hide it
Inside a desmos folder name it Cubic Bezier Curve do the following tasks.
Read about Bezier curves on page of your textbook.
a Define and for Plot each point for with connecting line segments. You should be able to drag any point as desired. Label the points and accordingly.
b Define functions and as the parametric equations for the bezier curve Section p will represent the coordinate, and will represent the coordinate. Then "hide" them by clicking the colored circles.
c Plot the parametric curve defined by for
Step by Step Solution
There are 3 Steps involved in it
1 Expert Approved Answer
Step: 1 Unlock

Question Has Been Solved by an Expert!
Get step-by-step solutions from verified subject matter experts
Step: 2 Unlock
Step: 3 Unlock