

Question: Project 2: Historical Simulation Complete your work using the excel file Hist_Simulation_Project2 and submit it via Project2 Dropbox. Find the attached file named Hist_Simulation_Project2. You
Project 2: Historical Simulation
Complete your work using the excel file "Hist_Simulation_Project2"
and submit it via Project2 Dropbox.
Find the attached file named "Hist_Simulation_Project2." You will use this file
to calculate VaR under the historical simulation approach. The first worksheet
"Historical data" shows historical data for 501 trading days for three indices,
S&P 500 index, DJIA index, and BofA Merrill Lynch US Corporate Index Total
Return Value. The value of the investment in each index on December 28,
2020 is as follows:
INDEX PORTOFOLIO VALUE('000S)
S&P 7,000
DJIA 5,000
BofA Merril Lynch 3,000
Total 15,000
1. Go to the second worksheet "500 Scenarios" and calculate the values
of the three indices on 12/29/2020 for 500 scenarios. For example,
Scenario 1 in the first row shows the values of the indices on
12/29/2020, assuming that their percentage changes between
12/28/2020 and 12/29/2020 are the same as they were between
01/02/2019 and 01/03/2019. You will repeat this for Days 1 through
500.
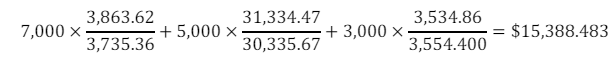
2. Once you calculate the values of the indices for 500 scenarios, you can
calculate the value of your portfolio. For example, the value of the
portfolio under Scenario 1 is
Step by Step Solution
There are 3 Steps involved in it

Get step-by-step solutions from verified subject matter experts