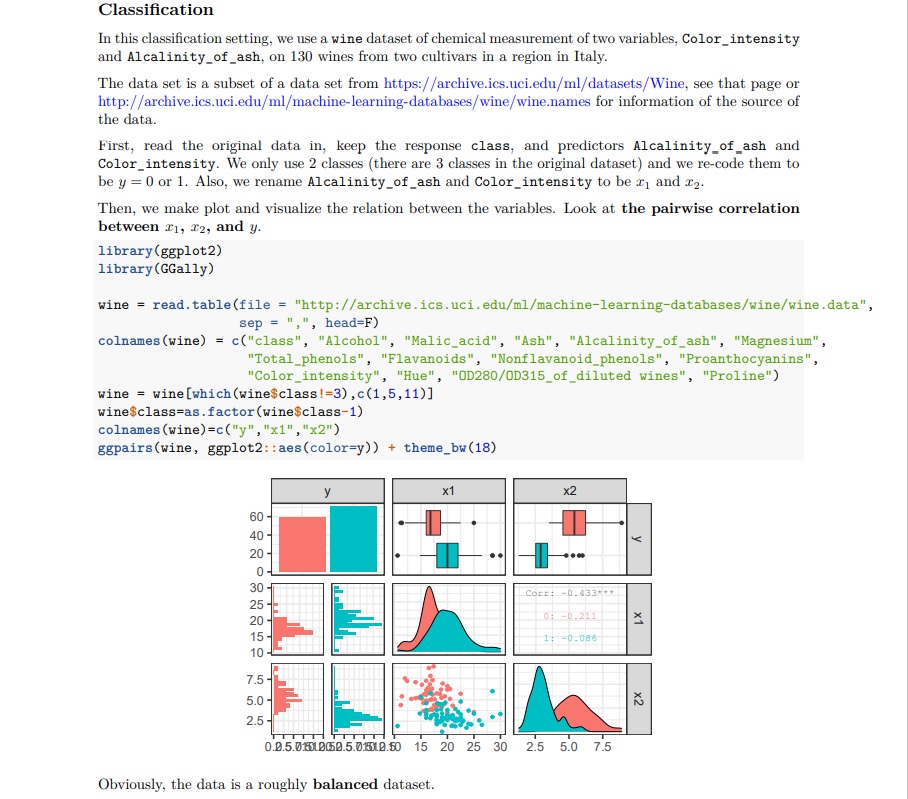
Question: Project 2 :Please answer each question after the blue Answer Classification In this classification setting, we use a wine dataset of chemical measurement of two

Project 2:Please answer each question after the blue "Answer"

Project 2 :Please answer each question after theProject 2 :Please answer each question after theProject 2 :Please answer each question after the
Classification In this classification setting, we use a wine dataset of chemical measurement of two variables, Color_intensity and Alcalinity_of_ash, on 130 wines from two cultivars in a region in Italy. The data set is a subset of a data set from https://archive.ics.uci.edu/ml/datasets/Wine, see that page or http://archive.ics.uci.edu/ml/machine-learning-databases/wine/wine.names for information of the source of the data. First, read the original data in, keep the response class, and predictors Alcalinity_of ash and Color_intensity. We only use 2 classes (there are 3 classes in the original dataset) and we re-code them to be y = 0 or 1. Also, we rename Alcalinity_of_ash and Color_intensity to be r, and 12. Then, we make plot and visualize the relation between the variables. Look at the pairwise correlation between 21, 12, and y. library (ggplot2) library (GGally) wine = read. table(file = "http://archive. ics. uci. edu/ml/machine-learning-databases/wine/wine. data", sep = ", ", head=F) colnames (wine) = c("class", "Alcohol", "Malic_acid", "Ash", "Alcalinity_of_ash", "Magnesium", "Total_phenols", "Flavanoids", "Nonflavanoid_phenols", "Proanthocyanins", "Color_intensity", "Hue", "OD280/0D315_of_diluted wines", "Proline") wine = wine [which (wine$class!=3) , c (1,5,11)] wine$class=as. factor(wine$class-1) colnames (wine)=c("y","x1","x2") ggpairs (wine, ggplot2: : aes(color=y) ) + theme_bw(18) y x1 x2 60- 40 - 20 0 - 30 Corr : - 0. 433+* * 25- 20 0: -0. 211 15 1 -0.086 10 7.5- 5.0- 2.5 TTT 0.0.5.0101 0(50.5.0:10.60 15 20 25 30 2.5 5.0 7.5 Obviously, the data is a roughly balanced dataset.Then, we would like to use Logistic regression, LDA, and KNN methods to estimate the test error rates. To do so, we will use the Validation Set approach. So, now we split the dataset to be the train and test datasets. n

Step by Step Solution

There are 3 Steps involved in it

1 Expert Approved Answer
Step: 1 Unlock blur-text-image
Question Has Been Solved by an Expert!

Get step-by-step solutions from verified subject matter experts

Step: 2 Unlock
Step: 3 Unlock

Students Have Also Explored These Related Mathematics Questions!