

Question: Project # 7 Statistical Graphs 1. The stacked bar chart below shows the composition of religious affiliation of incoming refugees to the United States for
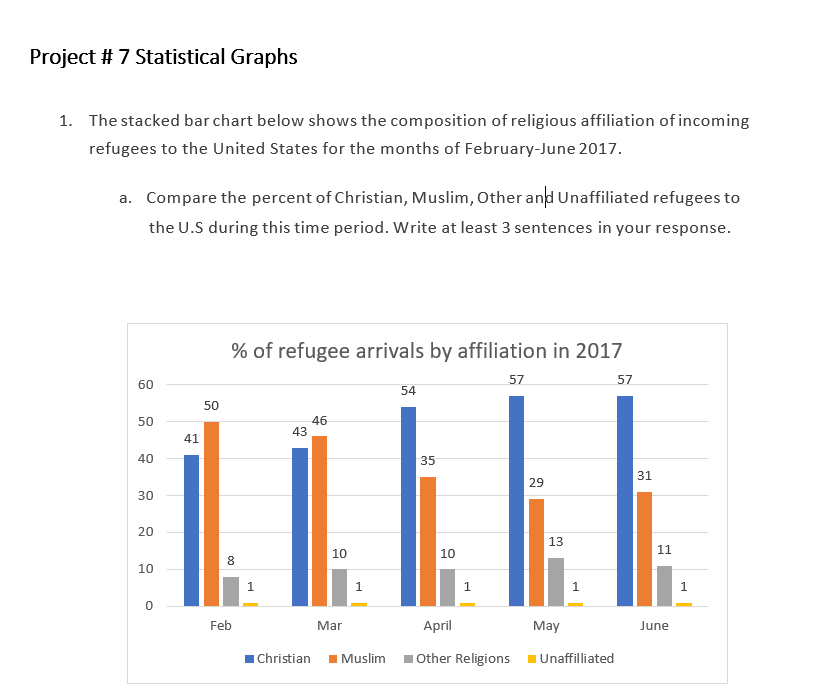

Project # 7 Statistical Graphs 1. The stacked bar chart below shows the composition of religious affiliation of incoming refugees to the United States for the months of February-June 2017. a. Compare the percent of Christian, Muslim, Other and Unaffiliated refugees to the U.S during this time period. Write at least 3 sentences in your response. % of refugee arrivals by affiliation in 2017 60 57 57 54 50 50 46 43 41 40 35 29 31 30 20 13 10 10 11 10 1 1 1 1 1 Feb Mar April May June Christian Muslim Other Religions . Unaffiliated
Step by Step Solution
There are 3 Steps involved in it
1 Expert Approved Answer
Step: 1 Unlock

Question Has Been Solved by an Expert!
Get step-by-step solutions from verified subject matter experts
Step: 2 Unlock
Step: 3 Unlock