

Question: Project A Project B Probability Cash Flows Probability Cash Flows 0.2 $6,500 0.2 $0 0.6 $7,000 0.6 $7,000 0.2 $7,500 0.2 $18,000 BPC has decided
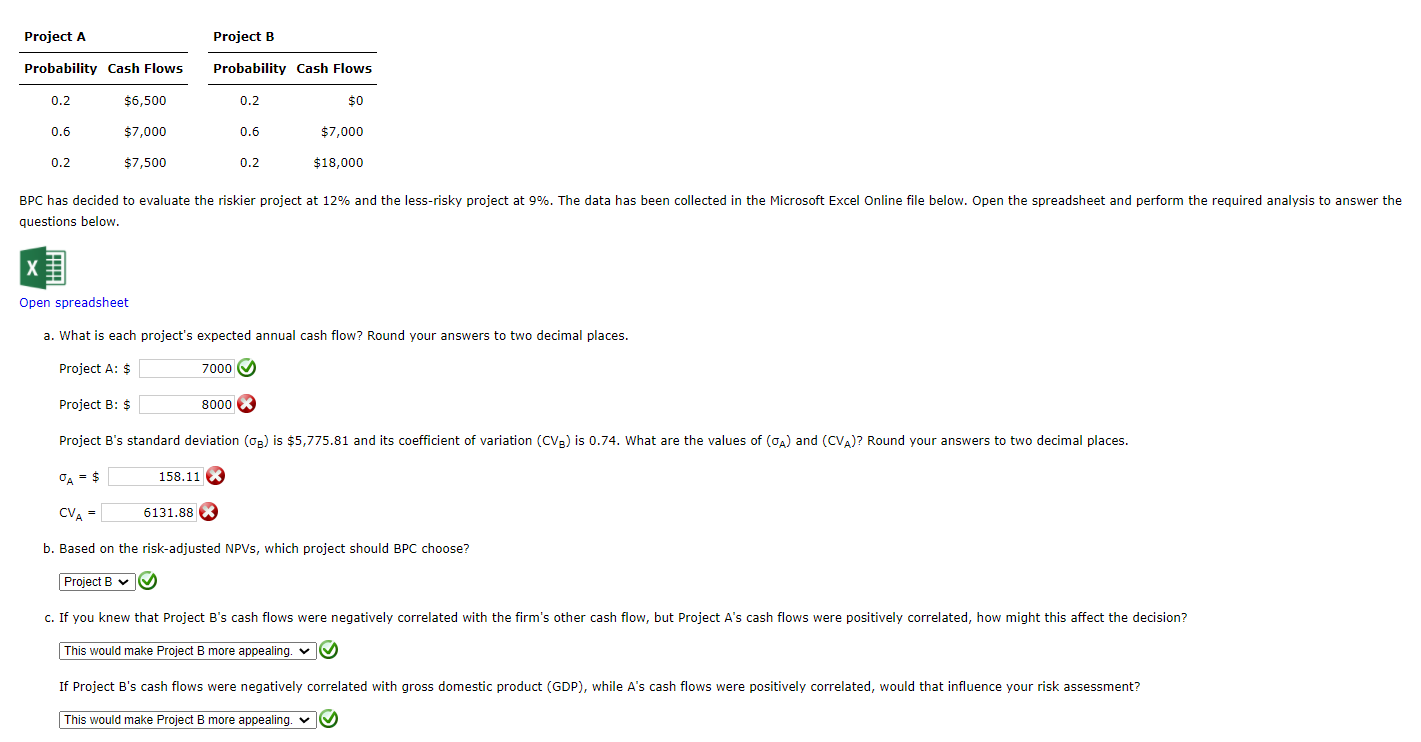
Project A Project B Probability Cash Flows Probability Cash Flows 0.2 $6,500 0.2 $0 0.6 $7,000 0.6 $7,000 0.2 $7,500 0.2 $18,000 BPC has decided to evaluate the riskier project at 12% and the less-risky project at 9%. The data has been collected in the Microsoft Excel Online file below. Open the spreadsheet and perform the required analysis to answer the questions below. Open spreadsheet a. What is each project's expected annual cash flow? Round your answers to two decimal places. Project A: $ 7000 g Project B: $ 8000 x Project B's standard deviation (B) is $5,775.81 and its coefficient of variation (CVB) is 0.74. What are the values of (CA) and (CVA)? Round your answers to two decimal places. 158.11 X CVA = 6131.88 X b. Based on the risk-adjusted NPVs, which project should BPC choose? Project Bg c. If you knew that Project B's cash flows were negatively correlated with the firm's other cash flow, but Project A's cash flows were positively correlated, how might this affect the decision? This would make Project more appealing. vg If Project B's cash flows were negatively correlated with gross domestic product (GDP), while A's cash flows were positively correlated, would that influence your risk assessment? This would make Project B more appealing
Step by Step Solution
There are 3 Steps involved in it

Get step-by-step solutions from verified subject matter experts