

Question: Project Description: In this project, you will design two classifiers: a naive Bayes classifier, and a perceptron classifier. You will test your classifiers on two
Project Description:
In this project, you will design two classifiers: a naive Bayes classifier, and a perceptron classifier. You will test your classifiers on two image data sets: a set of scanned handwritten digit images and a set of face images in which edges have already been detected. Even with simple features, your classifiers will be able to do quite well on these tasks when given enough training data.
Optical character recognition OCR is the task of extracting text from image sources. The first data set on which you will run your classifiers is a collection of handwritten numerical digits This is a very commercially useful technology, similar to the technique used by the US post office to route mail by zip codes. There are systems that can perform with over classification accuracy see LeNet for an example system in action
Face detection is the task of localizing faces within video or still images. The faces can be at any location and vary in size. There are many applications for face detection, including human computer interaction and surveillance. You will attempt a simplified face detection task in which your system is presented with an image that has been preprocessed by an edge detection algorithm. The task is to determine whether the edge image is a face or not.
Which Digit?
What you should do:
Implement two classification algorithms for detecting faces and classifying digits:
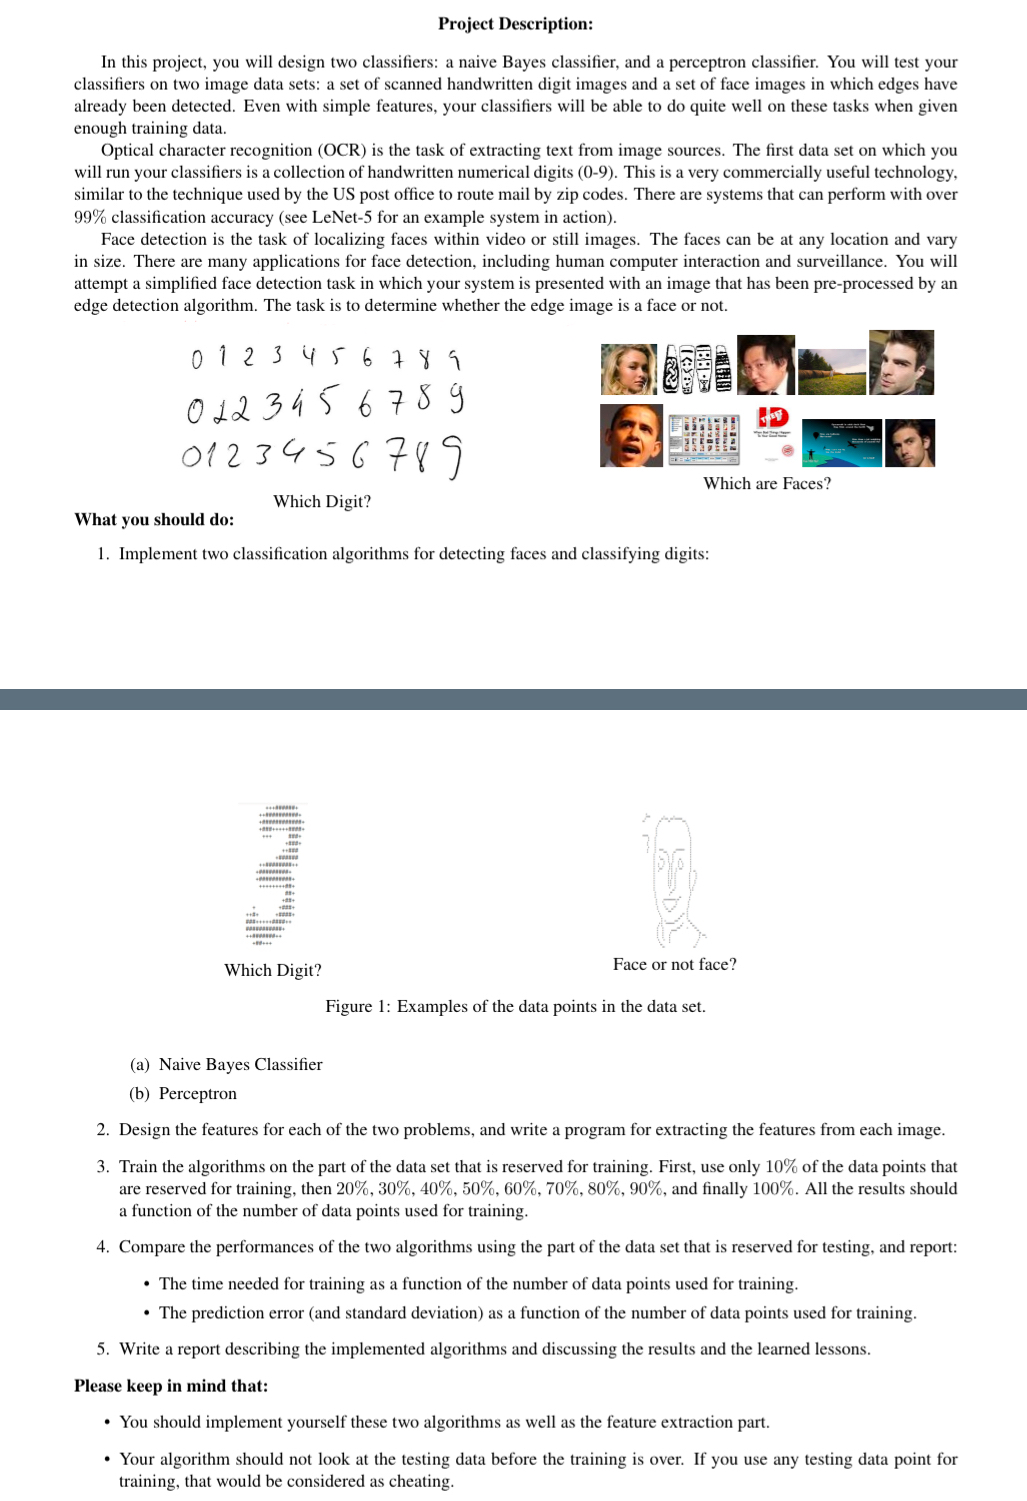
Which Digit?
Face or not face?
Figure : Examples of the data points in the data set.
a Naive Bayes Classifier
b Perceptron
Design the features for each of the two problems, and write a program for extracting the features from each image.
Train the algorithms on the part of the data set that is reserved for training. First, use only of the data points that are reserved for training, then and finally All the results should a function of the number of data points used for training.
Compare the performances of the two algorithms using the part of the data set that is reserved for testing, and report:
The time needed for training as a function of the number of data points used for training.
The prediction error and standard deviation as a function of the number of data points used for training.
Write a report describing the implemented algorithms and discussing the results and the learned lessons.
Please keep in mind that:
You should implement yourself these two algorithms as well as the feature extraction part.
Your algorithm should not look at the testing data before the training is over. If you use any testing data point for training, that would be considered as cheating.
Step by Step Solution
There are 3 Steps involved in it
1 Expert Approved Answer
Step: 1 Unlock

Question Has Been Solved by an Expert!
Get step-by-step solutions from verified subject matter experts
Step: 2 Unlock
Step: 3 Unlock