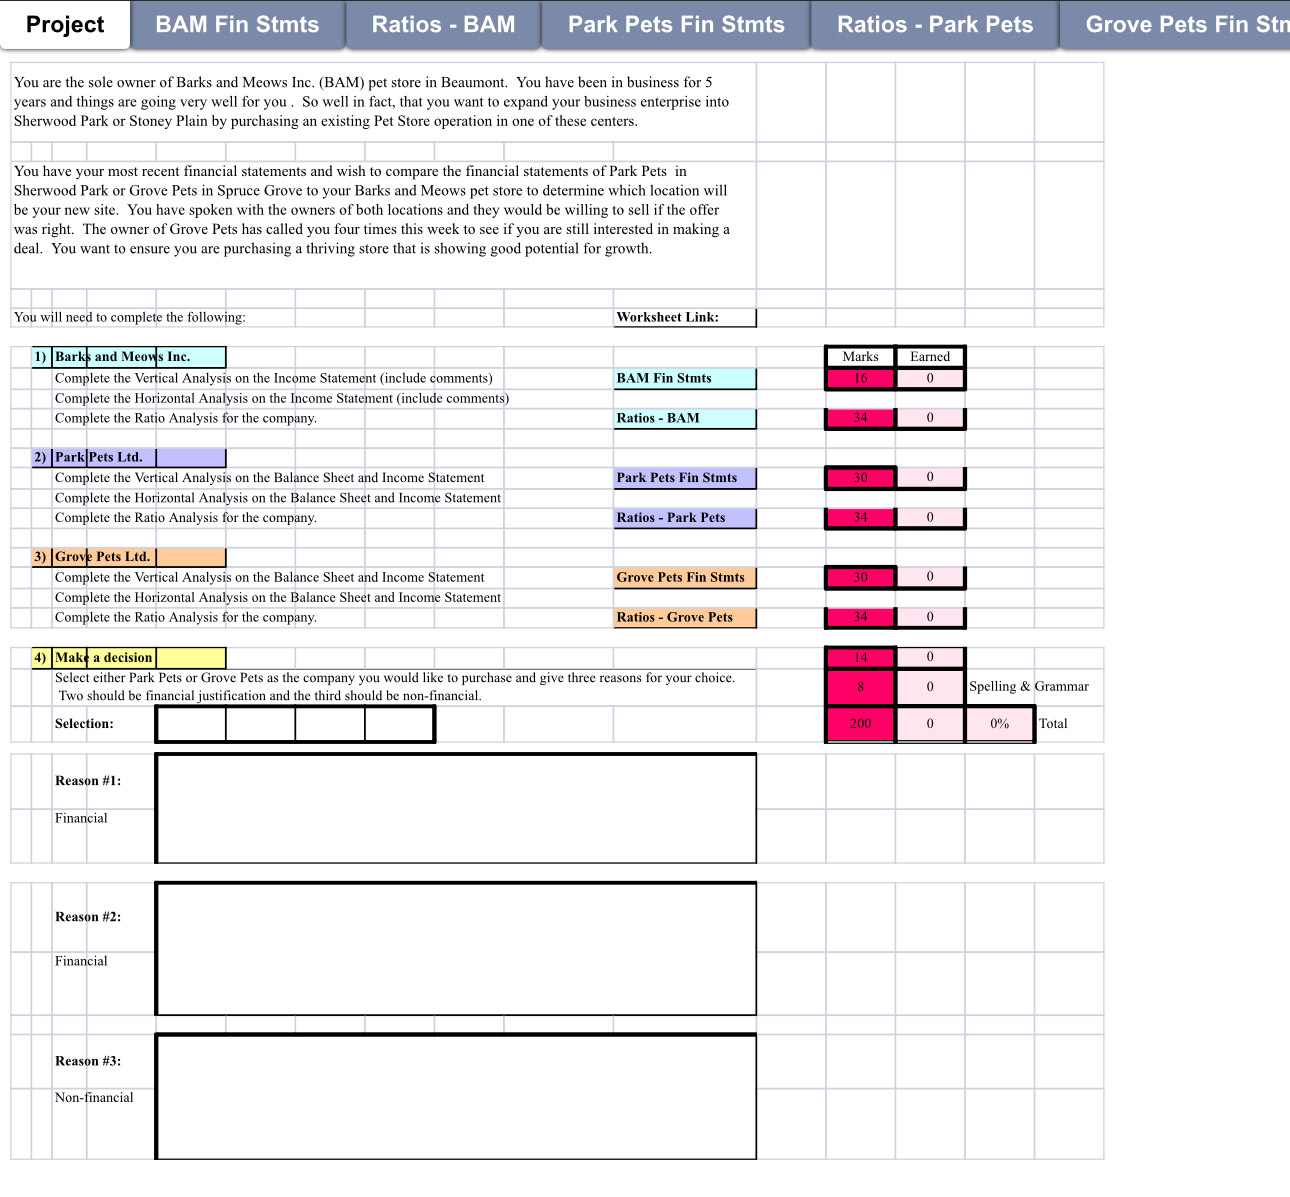
Question: Project eyN UM tee) Ratios - BAM rae Ratios - Park Pets You are the sole owner of Barks and Meows Inc. (BAM) pet store
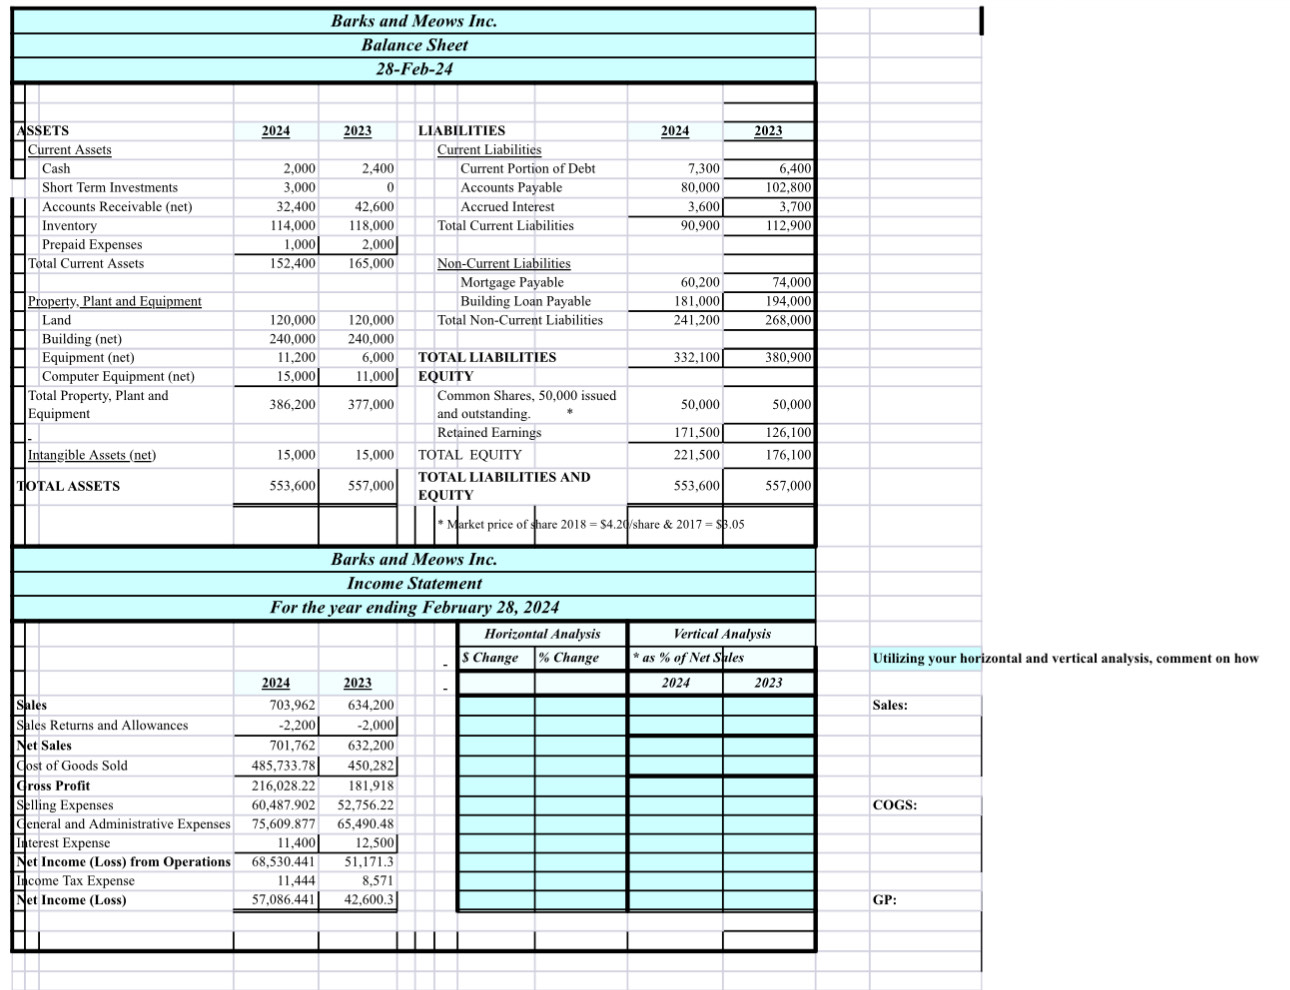
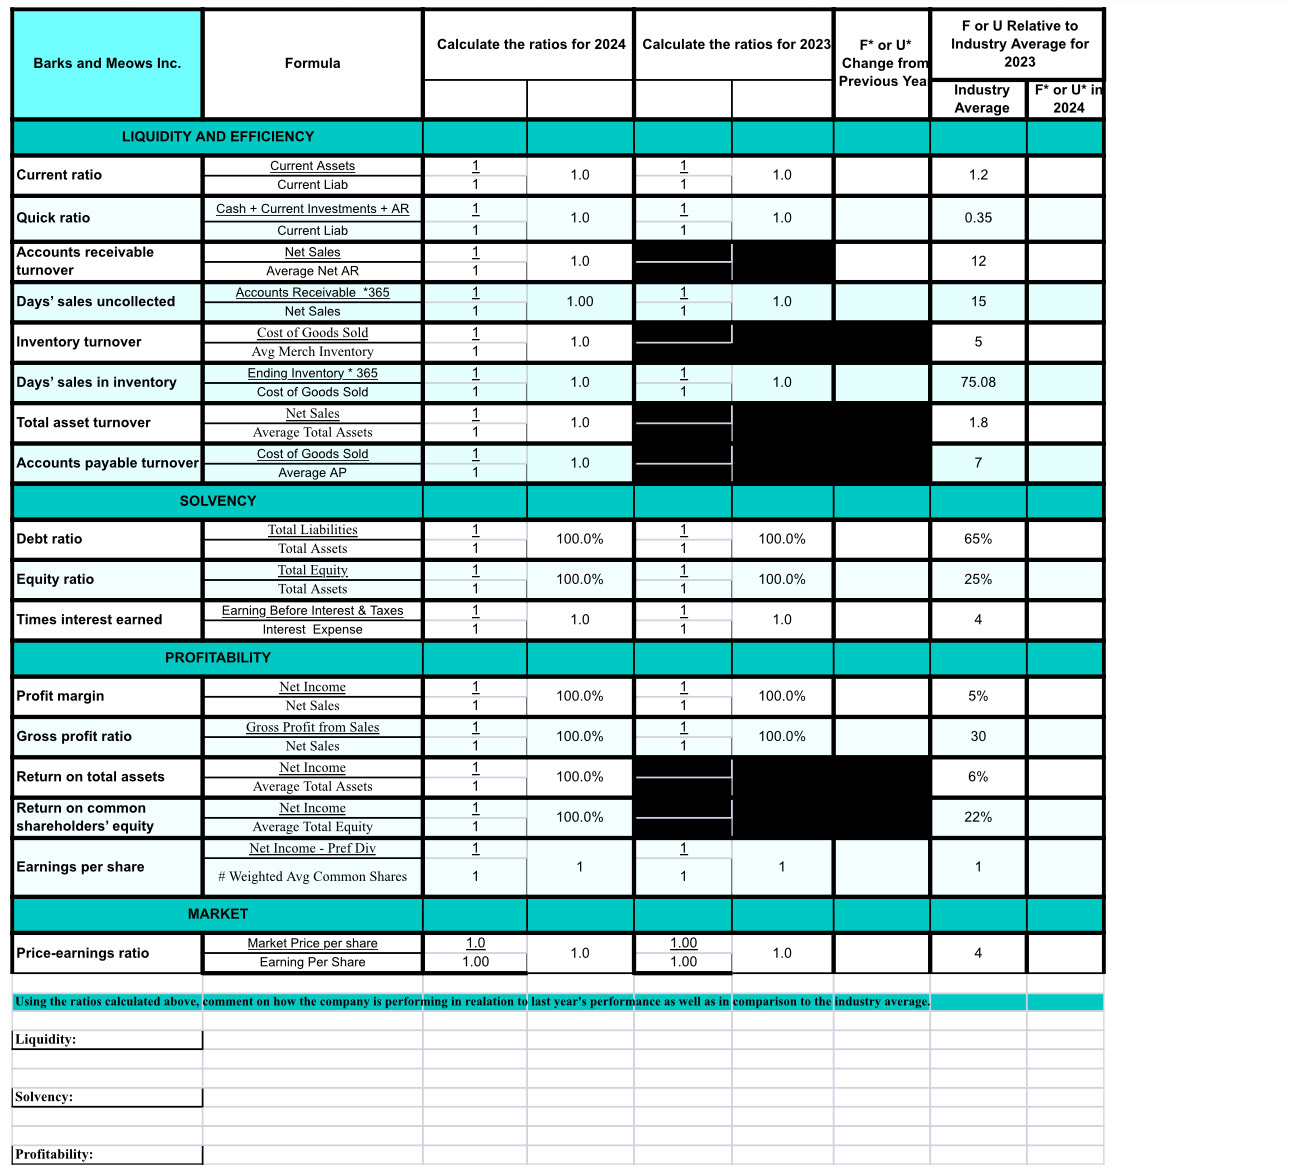
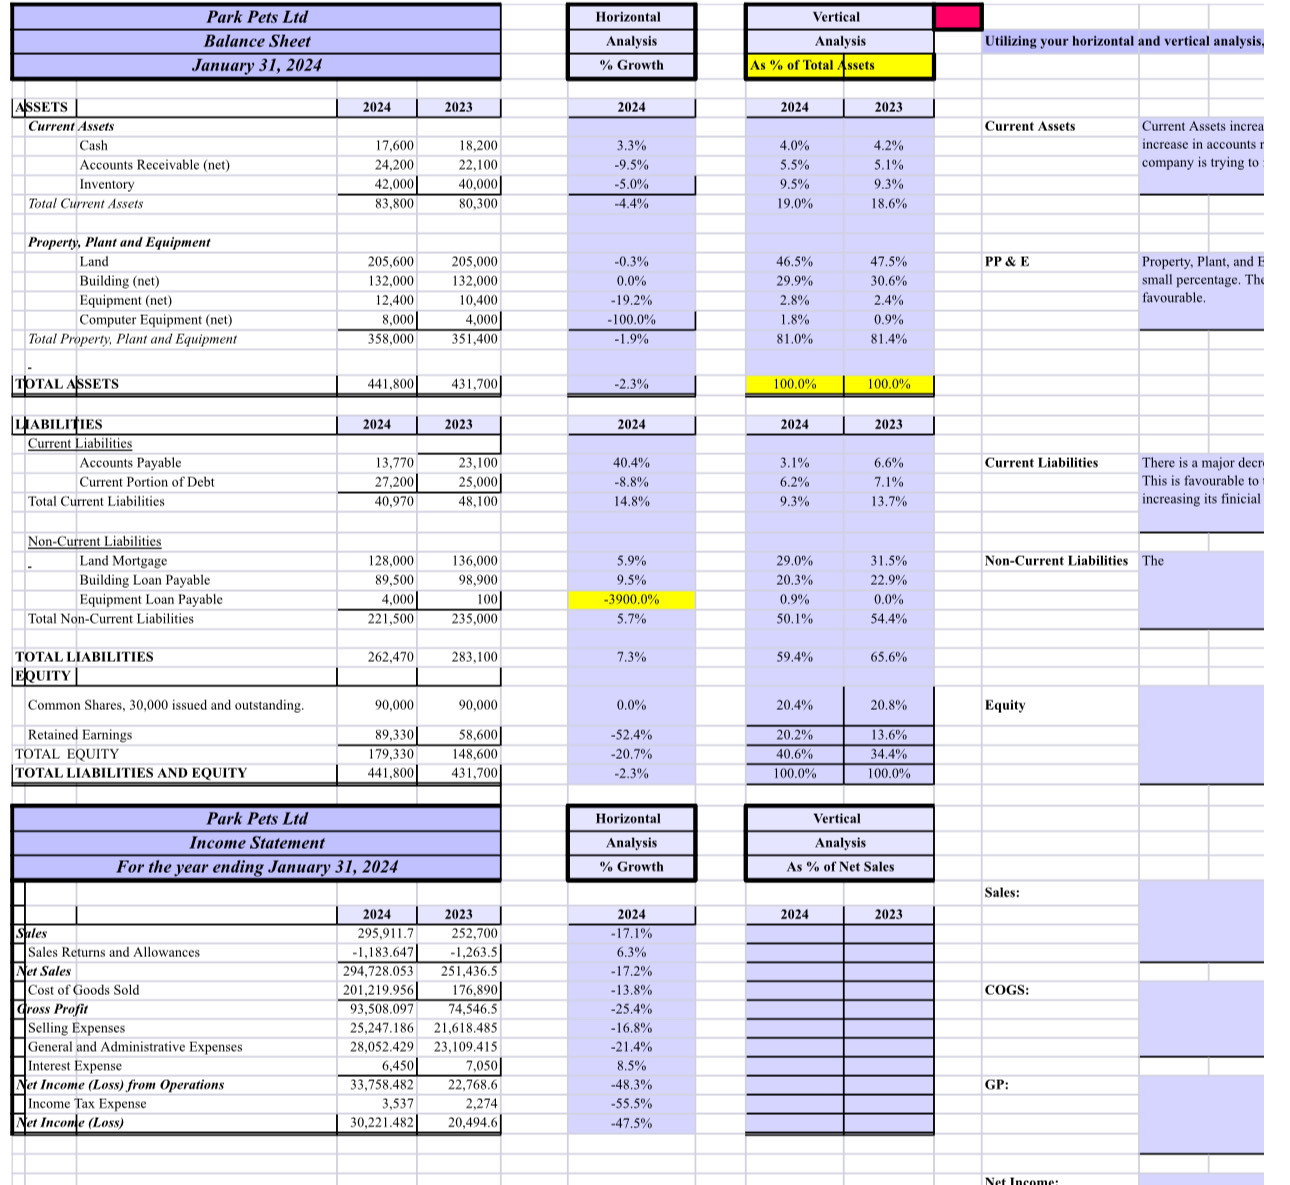
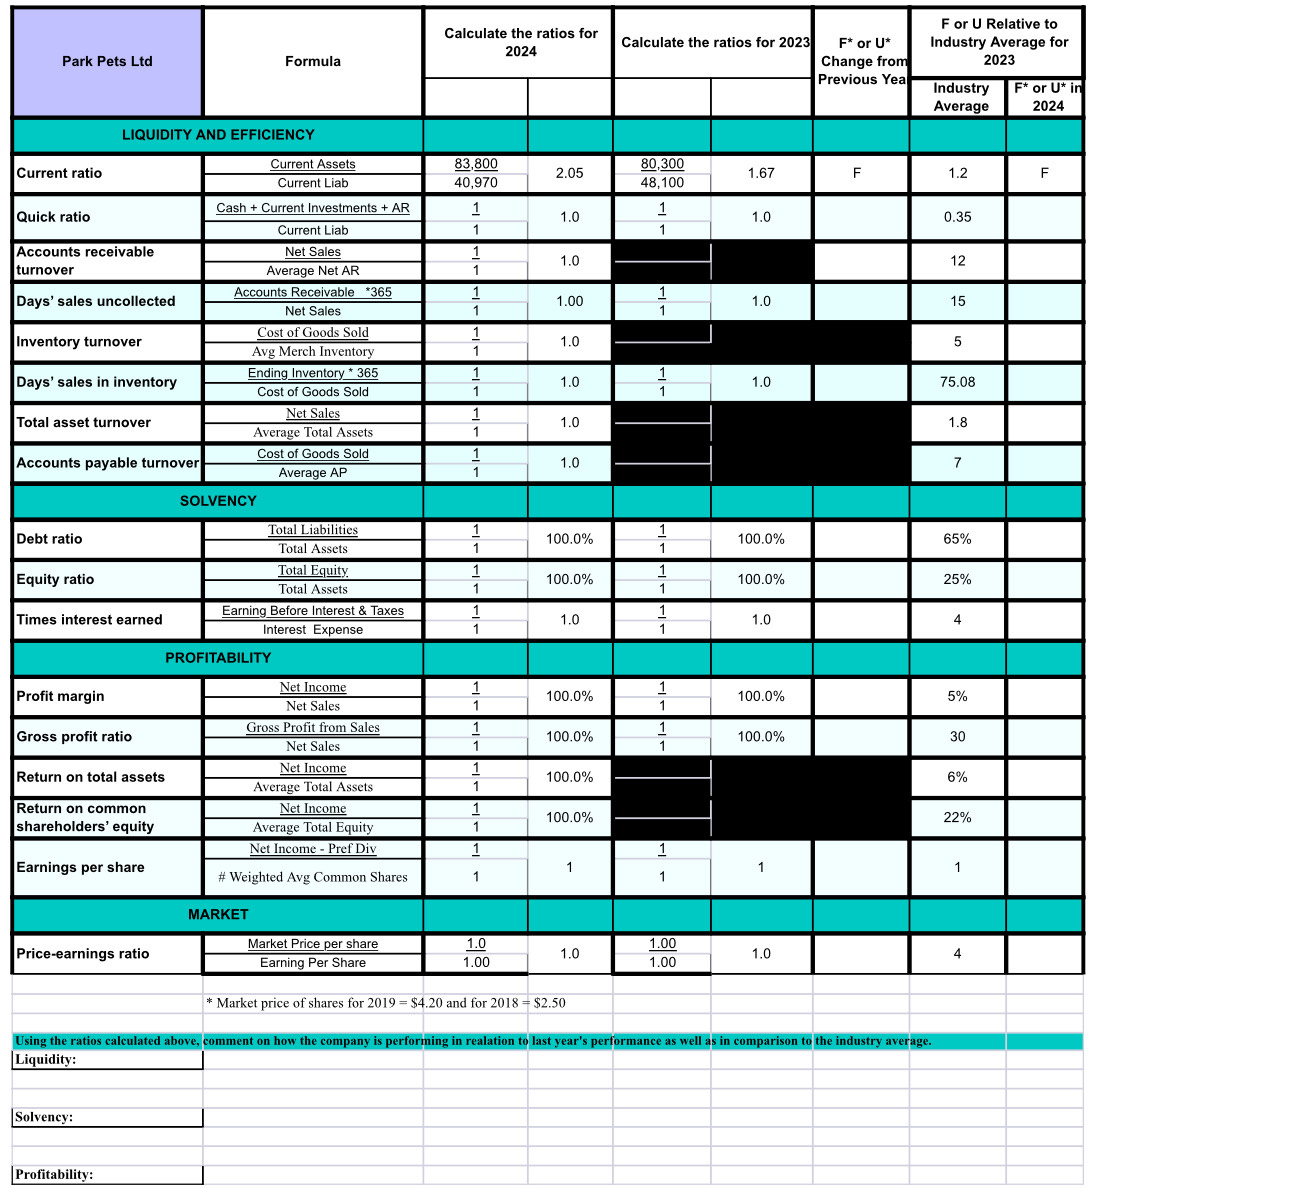
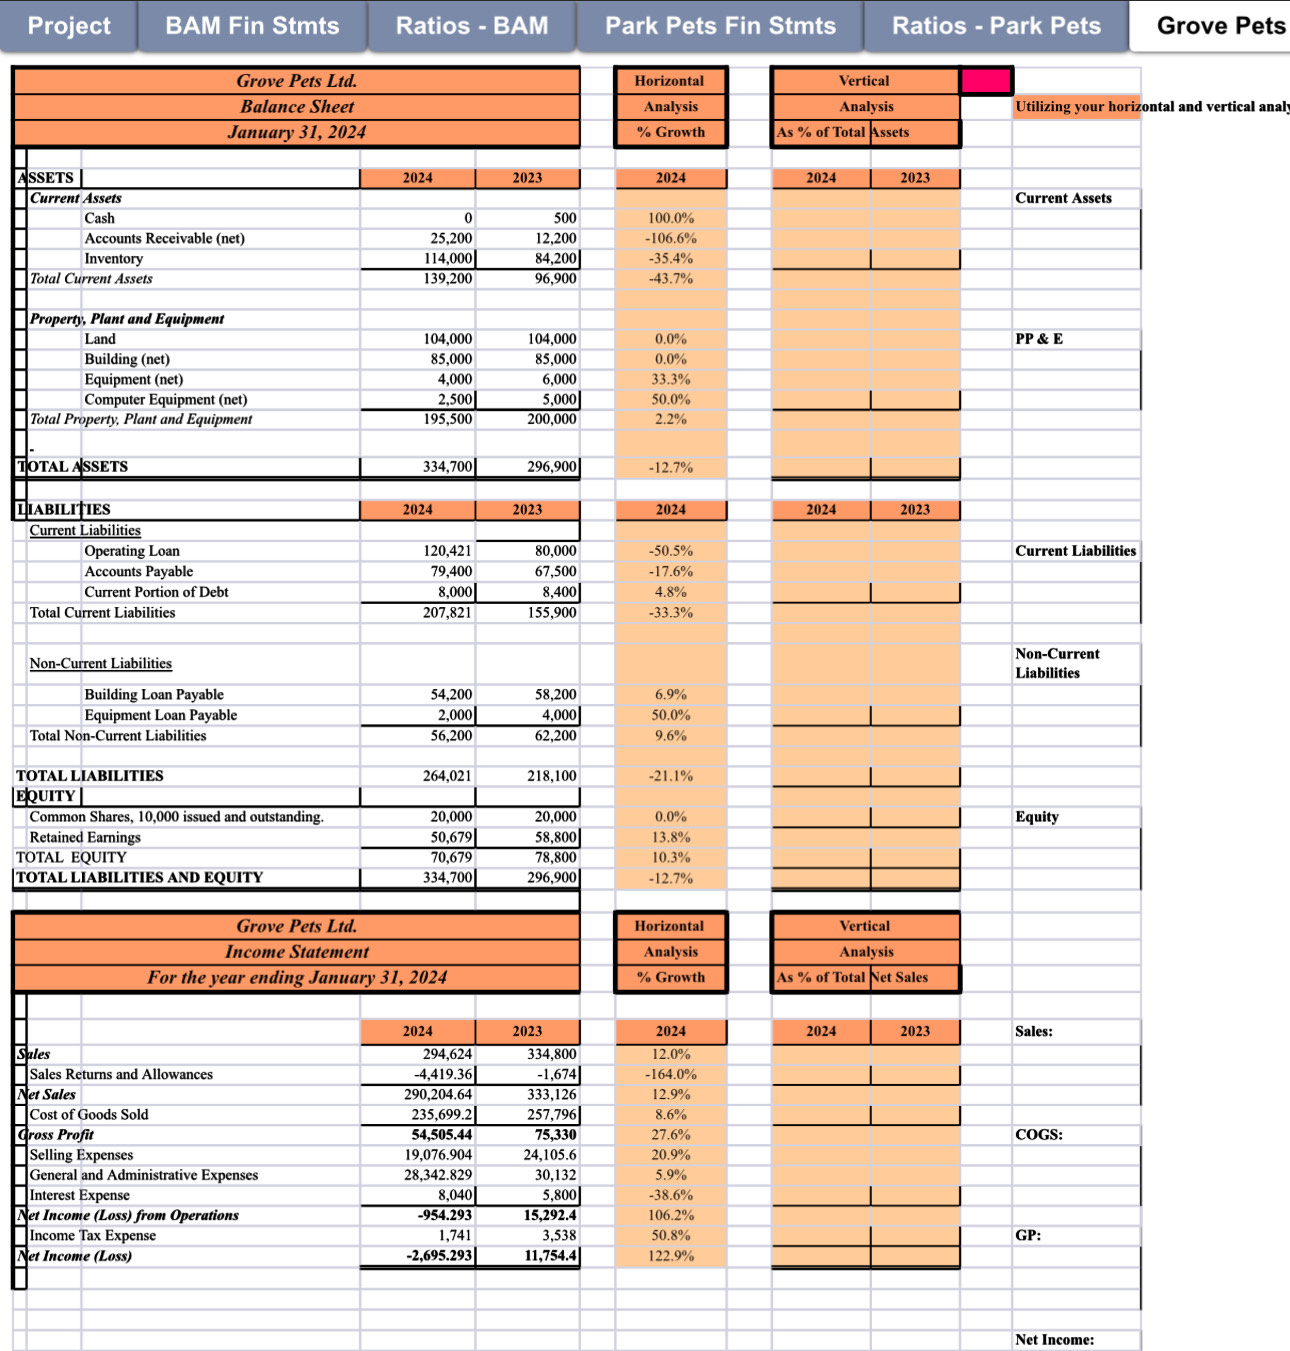
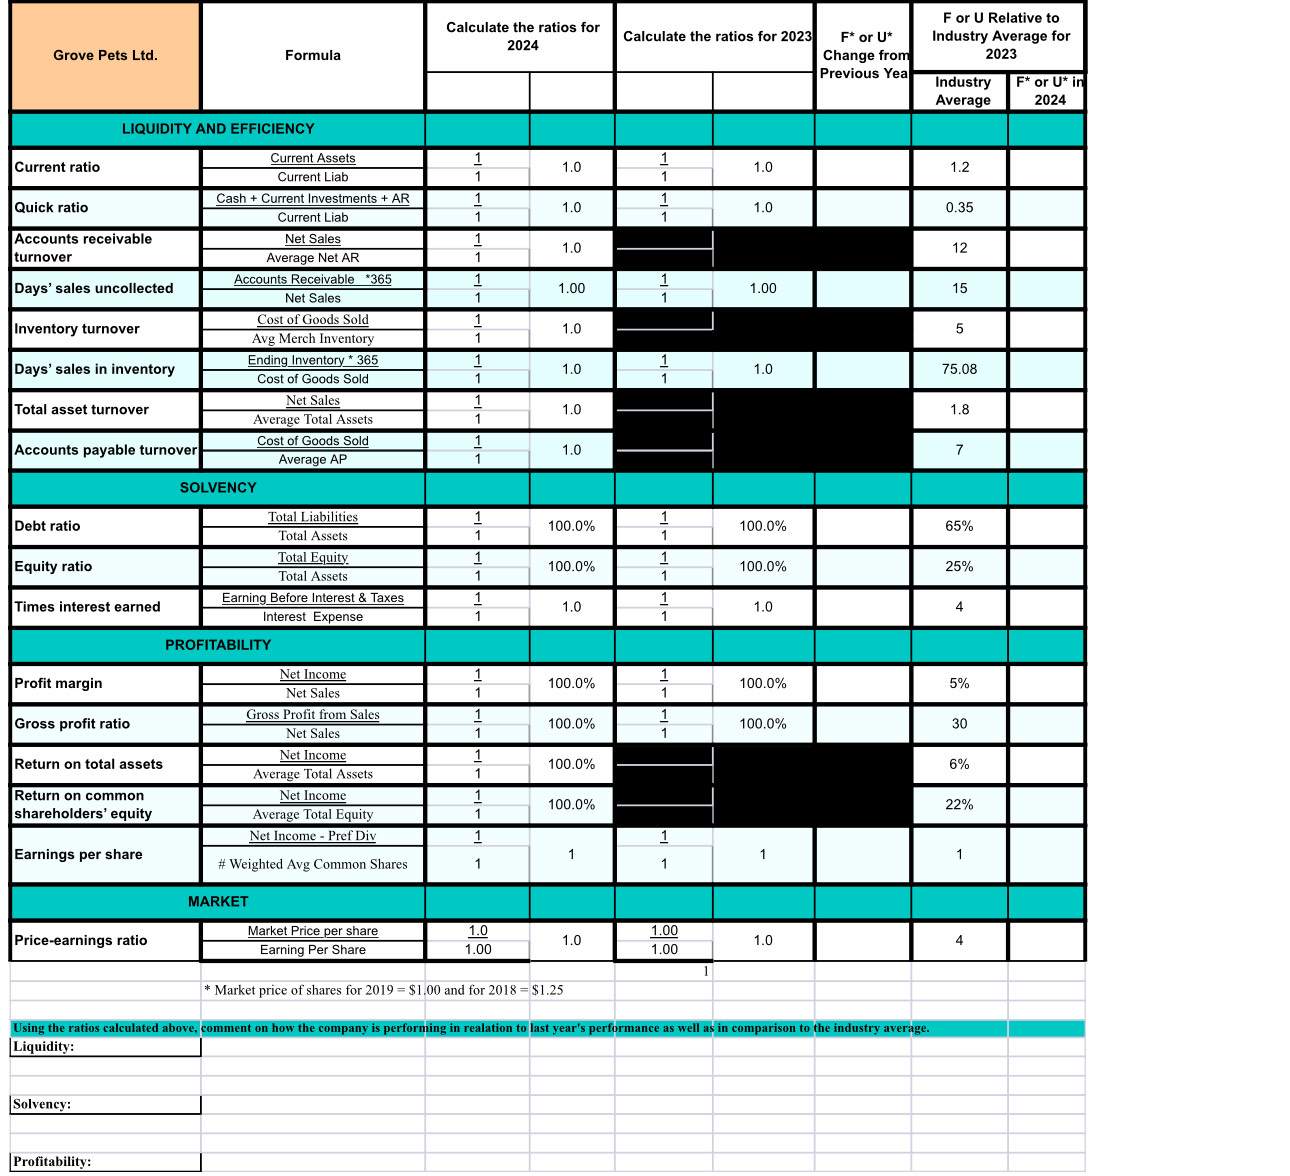
Project eyN UM tee) Ratios - BAM rae Ratios - Park Pets You are the sole owner of Barks and Meows Inc. (BAM) pet store in Beaumont. You have been in business for 5 years and things are going very well for you . So well in fact, that you want to expand your business enterprise into Sherwood Park or Stoney Plain by purchasing an existing Pet Store operation in one of these centers. You have your most recent financial statements and wish to compare the financial statements of Park Pets in Sherwood Park or Grove Pets in Spruce Grove to your Barks and Meows pet store to determine which location will be your new site. You have spoken with the owners of both locations and they would be willing to sell if the offer was right. The owner of Grove Pets has called you four times this week to see if you are still interested in making a deal. You want to ensure you are purchasing a thriving store that is showing good potential for growth. You will need to complete the following: Worksheet Link: | 1 [Barif and Meow tne] Famed Complete the Vertical Analysis on the Income Statement (include comments) BAM Fin Stmts | Complete the Horizontal Analysis on the Income Statement (include comments) Complete the Ratio Analysis for the company. Ratios - BAM | 2) |Park|Pets Ltd. Complete the Vertical Analysis on the Balance Sheet and Income Statement Park Pets Fin Stmts | Complete the Horizontal Analysis on the Balance Sheet and Income Statement a0 | | = | Complete the Ratio Analysis for the company. Ratios - Park Pets | i 3) Grove Pets Lid. | mz | am Complete the Vertical Analysis on the Balance Sheet and Income Statement Grove Pets Fin Stmts | Complete the Horizontal Analysis on the Balance Sheet and Income Statement Complete the Ratio Analysis for the company. Ratios - Grove Pets | [Marfa decision] Select cither Park Pets or Grove Pets as the company you would like to purchase and give three reasons for your choice. Two should be financial justification and the third should be non-financial. Selection: Reason #1: Financial Reason #2: Financial Reason #3: Non-financial Barks and Meows Inc. Balance Sheet 28-Feb-24 ASSETS 2024 2023 LIABILITIES 2024 2023 Current Assets Current Liabilities Cash 2,000 2,400 Current Portion of Debt 7,300 6,400 Short Term Investments 3.000 Accounts Payable 80,00 02,800 Accounts Receivable (net) 32.400 42,600 Accrued Interest 3,600 3,70 Inventory 114,000 118,000 Total Current Liabilities 90,900 12,900 Prepaid Expenses 1,000 2,000 Total Current Assets 152,400 165,000 Non-Current Liabilities Mortgage Payable 60,200 74,000 Property, Plant and Equipment Building Loan Payable 181,000 194,000 Land 120,000 120,000 Total Non-Current Liabilities 241,200 268,000 Building (net) 240,000 240,000 Equipment (net) 11,200 6,000 TOTAL LIABILITIES 332,100 380,900 Computer Equipment (net) 15,000 11,000 EQUITY Total Property, Plant and Equipment 386,200 377,000 Common Shares, 50,000 issued 50,000 and outstanding. 50,000 Retained Earnings 171,500 126,100 Intangible Assets (net) 15,000 15,000 TOTAL EQUITY 221,500 176,100 TOTAL ASSETS 553,600 557,000 TOTAL LIABILITIES AND EQUITY 553,600 557,00 * Market price of share 2018 = $4.20/share & 2017 = $3.05 Barks and Meows Inc. Income Statement For the year ending February 28, 2024 Horizontal Analysis Vertical Analysis S Change % Change * as % of Net Sales Utilizing your horizontal and vertical analysis, comment on how 2024 2023 2024 2023 Sales 703,962 634,200 Sales: Sales Returns and Allowances -2,200 -2,000 Net Sales 701,762 632,200 Cost of Goods Sold 485,733.78 450,282 Gross Profit 216,028.22 181,918 Selling Expenses 60,487.902 52,756.22 COGS: General and Administrative Expenses 75,609.877 65,490.48 Interest Expense 11,400 12,500 Net Income (Loss) from Operations 68,530.441 51,171.3 Income Tax Expense 11,444 8,571 Net Income (Loss) 57,086.441 42,600.3 GP:F or U Relative to Calculate the ratios for 2024 | Calculate the ratios for 2023 F* or U* Barks and Meows Inc. Industry Average for Formula Change from 2023 Previous Yea Industry F* or U* in Average 2024 LIQUIDITY AND EFFICIENCY Current ratio Current Assets Current Liab 1.0 1 1.0 1.2 Quick ratio Cash + Current Investments + AR 1.0 1 10 0.35 Current Lial Accounts receivable Net Sales turnover Average Net AR 12 Days' sales uncollected Accounts Receivable *365 Net Sales 1.C 15 Inventory turnover Cost of Goods Sold Avg Merch Inventory 5 sales in inventory Ending Inventory * 365 1 Cost of Goods Sold 1.0 75.08 Total asset turnover Net Sales Average Total Assets 1.8 Accounts payable turnove Cost of Goods Sold Average AP 7 SOLVENCY Debt ratio Total Liabilities 1 100.0% - I- Total Assets 100.0% 65% Equity ratio Total Equity - 1-- Total Assets 100.0% 1 100.0% 25% Times interest earned Earning Before Interest & Taxes 1 1 1.0 1 Interest Expense 1 1.0 4 PROFITABILITY Profit margin Net Income Net Sales 100.0% 100.0% 5% Gross profit ratio Gross Profit from Sales 1 Net Sales 1 100.0% 100.0% 30 Return on total assets Net Income 1 Average Total Assets 100.0% 6% Return on common Net Income shareholders' equity Average Total Equity 1 100.0% 22% Net Income - Pref Div 1 Earnings per share # Weighted Avg Common Shares 1 MARKET Price-earnings ratio Market Price per share 1.0 1.00 1.00 1.0 Earning Per Share 1.00 1.0 Using the ratios calculated above, comment on how the company is performing in realation to last year's performance as well as in comparison to the industry average. Liquidity: Solvency: Profitability:Park Pets Lid Horizontal Vertical Balance Sheet Analysis Analysis Utilizing your horizontal and vertical analysis, January 31, 2024 Growth As % of Total Assets ASSETS 2024 2023 2024 2024 2023 Current Assets Current Assets Current Assets increa Cash 17,600 18,200 3.3% 4.0% 4.2% increase in accounts r Accounts Receivable (net) 24,200 22,100 -9.5% 5.5% 5.1% company is trying to Inventory 42,000 40,000 5.0% 9.5% 9.3% Total Current Assets 83,800 30,300 4.4% 19.0% 18.6% Property, Plant and Equipment Land 205,600 205,000 -0.3% 46.5% 47.5% PP & E Property, Plant, and E Building (net) 132,000 132,000 0.0% 29.9% 30.6% small percentage. The Equipment (net) 12,400 10,400 -19.2% 2.8% 2.4% favourable Computer Equipment (net) 8,000 4,000 -100.0% 1.8% 0.9% Total Property. Plant and Equipment 358,000 351,400 -1.9% 81.0% 81.4% TOTAL ASSETS 441,800 431,700 -2.3% 100.0% 100.0% LIABILITIES 2024 2023 2024 2024 2023 Current Liabilities Accounts Payable 13,770 23,100 40.4% 3.1% 6.6% Current Liabilities There is a major decn Current Portion of Debt 27,200 25.000 -8.8% 6.2% 7.1% This is favourable to Total Current Liabilities 40,970 48,100 14.8% 9.3% 13.7% increasing its finicial Non-Current Liabilities Land Mortgage 128,000 136,00 5.9% 29.0% 31.5% Non-Current Liabilities The Building Loan Payable 89,500 98.900 9.5% 20.3% 22.9% Equipment Loan Payable 4,000 100 -3900.0% 0.9% 0.0% Total Non-Current Liabilities 221,500 235,000 5.7% 50.1% 54.4% TOTAL LIABILITIES 262,470 283,100 7.3% 59.4% 65.6% EQUITY Common Shares, 30,000 issued and outstanding. 90,000 90.000 0.0% 20.4% 20.8% Equity Retained Earnings 89,330 58,600 -52.4% 20.2% 13.6% TOTAL EQUITY 179,330 148,600 .20.7% 40.6% 34.4% TOTAL LIABILITIES AND EQUITY 441,800 431,700 -2.3% 100.0% 00.0% Park Pets Lid Horizontal Vertical Income Statement Analysis Analysis For the year ending January 31, 2024 % Growth As % of Net Sales Sales: 2024 2023 2024 2024 2023 Sales 295,911.7 252,700 -17.1% Sales Returns and Allowances -1,183.647 -1,263.5 6.3% Net Sales 294,728.053 251,436.5 -17.2% Cost of Goods Sold 201,219.956 176,890 -13.8% COGS: Gross Profit 93,508.097 4,546.5 -25.4% Selling Expenses 25,247.186 21,618.485 -16.8% General and Administrative Expenses 28,052.429 23,109.415 -21.4% Interest Expense 6,450 7,050 8.5% Net Income (Loss) from Operations 33,758.482 22,768.6 48.3% GP: Income Tax Expense 3,537 2.274 -55.5% Net Income (Loss) 30,221.482 20,494.6 -47.5%Calculate the ratios for F or U Relative to 2024 Calculate the ratios for 2023 F* or U* Industry Average for Park Pets Ltd Formula Change from 2023 Previous Yea Industry F* or U* in Average 2024 LIQUIDITY AND EFFICIENCY Current ratio Current Asset 83,80 10,30 40,970 2.05 48,100 1.67 F 1.2 F Current Liab Quick ratio Cash + Current Investments + AR 1.0 1.0 0.35 Current Liab Accounts receivable Net Sales turnover 1.0 12 Average Net AR Accounts Receivable *365 s uncollect 1 1.00 1 1.0 15 Net Sales 1 Inventory turnover Cost of Goods Sold 1 1.0 5 Avg Merch Inventory Days' sales in inventory Ending Inventory * 365 1 1.0 1.0 Cost of Goods Sold 75.08 Total asset turnover Net Sales 1 1.0 1.8 Average Total Assets Accounts payable turnover Cost of Goods Sold 1.0 7 Average AP SOLVENCY Debt ratio Total Liabilities 100.0% Total Assets 100.0% 65% Equity ratio Total Equity 100.0% 100.0% 25% otal Assets Earning Before Interest & Taxes - 1- Times interest earned 1.0 1.0 Interest Expense 4 PROFITABILITY Profit margin Net Income 100.0% 100.0% 5% Net Sales I-|-I- Gross profit ratio Gross Profit from Sales 100.0% Net Sales 100.0% 30 Return on total assets Net Income 100.0% 6% Average Total Assets Return on common Net Income - 1-I shareholders' equity 100.0% Average Total Equity 22% Net Income - Pref Div 1 Earnings per share 1 # Weighted Avg Common Shares 1 1 MARKET Price-earnings ratio Market Price per share 1.0 1.00 1.0 Earning Per Share 1.00 1.00 1.0 4 * Market price of shares for 2019 = $4.20 and for 2018 = $2.50 Using the ratios calculated above, comment on how the company is performing in realation to last year's performance as well as in comparison to the industry average. Liquidity: Solvency: Profitability:Project BAM Fin Stmts Ratios - BAM Park Pets Fin Stmts Ratios - Park Pets Grove Pets Grove Pets Lid. Horizontal Vertical Balance Sheet Analysis Analysis Utilizing your horizontal and vertical anal January 31, 2024 % Growth As % of Total Assets ASSETS 2024 2023 2024 2024 2023 Current Assets Current Assets Cash 0 50 100.0% Accounts Receivable (net) 5,200 12,200 106.6% Inventory 14,000 84,200 -35.4% Total Current Assets 39,200 6,900 -43.7% Property, Plant and Equipment Land 104,000 104.000 0.0% PP & E Building (net) $5,000 35,000 0.0% Equipment (net 4,000 5,000 33.3% Computer Equipment (net) 2,500 5,000 50.0% Total Property, Plant and Equipment 195,500 200,000 2.2% TOTAL ASSETS 334,700 296.900 -12.7% LIABILITIES 2024 2023 2024 2024 2023 Current Liabilities Operating Loan 120,421 80,000 -50.5% Current Liabilities Accounts Payable 79,400 67,500 17.6% Current Portion of Debt 8,000 8,400 4.8% Total Current Liabilities 207,821 155,900 -33.3% Non-Current Liabilities Non-Current Liabilities ilding Loan Payable $4,200 58,200 6.9% Equipment Loan Payable 2,000 4,000 50.0% Total Non-Current Liabilities 56,200 $2,200 9.6% TOTAL LIABILITIES 264,021 218,100 -21.1% EQUITY Common Shares, 10,000 issued and outstanding 20,000 20,00 0.0% Equity Retained Earnings 50,679 58,800 13.8% TOTAL EQUITY 70,679 78,800 0.3% TOTAL LIABILITIES AND EQUITY 334,700 296,900 -12.7% Grove Pets Lid. Horizontal Vertical Income Statement Analysis Analysis For the year ending January 31, 2024 % Growth As % of Total Net Sales 2024 2023 2024 2024 2023 Sales: Sales :94,624 34,800 12.0% Sales Returns and Allowances 4,419.36 -1,674 164.0% Net Sales 290,204.64 $33,126 12.9% Cost of Goods Sold 235,699.2 257,796 8.6% Gross Profit 54,505.44 75,330 27.6% COGS: Selling Expenses 19,076.904 24,105. 20.9% General and Administrative Expenses 28,342.829 30,132 5.9% Interest Expense 8,040 5,800 -38.6% Net Income (Loss) from Operations -954.293 5,292.4 06.2% Income Tax Expense 1,74 ,538 50.8% GP: Net Income (Loss) -2,695.293 11,754.4 122.9% Net Income:Calculate the ratios for F or U Relative to Grove Pets Ltd. 2024 Calculate the ratios for 2023 F* or U* Industry Average for Formula Change from 2023 Previous Yea Industry F* or U* in Average 2024 LIQUIDITY AND EFFICIENCY Current ratio Current Assets Current Liab 1.0 1 1.0 1.2 Quick ratio Cash + Current Investments + AR 1 1.0 Current Lia 1.0 0.35 Accounts receivable Net Sales 1 turnover 1.0 Average Net AR 12 Days' sales uncollected Accounts Receivable *365 1 Net Sales 1.00 1.00 15 Inventory turnover Cost of Goods Sold 1 1.0 5 Avg Merch Inventory Days' sales in inventory Ending Inventory * 365 1 - 1- Cost of Goods Sold 1.0 1.0 75.08 Total asset turnover Net Sales Average Total Assets 1 1.0 1.8 Accounts payable turnover Cost of Goods Sold 1 Average AP 1.0 7 SOLVENCY Debt ratio Total Liabilities 100.0% - I- 65% Total Assets 100.0% Equity ratio Total Equity 100.0% Total Assets 100.0% 25% Times interest earned Earning Before Interest & Taxes 1 1 Interest Expense 1.0 1.0 4 PROFITABILITY Profit margin Net Income - I- 100.0% -I- 100.0% 5% Net Sales Gross profit ratio Gross Profit from Sales - 1- Net Sales 100.0% - 1- 100.0% 30 Return on tota Net Income 100.0% 6% Average Total Assets Return on common Net Income 1 shareholders' equity Average Total Equity 100.0% 22% Net Income - Pref Div Earnings per share # Weighted Avg Common Shares 1 MARKET Price-earnings ratio Market Price per share 1.0 1.00 Earning Per Share 1.00 1.0 1.00 1.0 4 * Market price of shares for 2019 = $1.00 and for 2018 = $1.25 Using the ratios calculated above, comment on how the company is performing in realation to last year's performance as well as in comparison to the industry average. Liquidity: Solvency: Profitability
Step by Step Solution
There are 3 Steps involved in it
1 Expert Approved Answer
Step: 1 Unlock
Question Has Been Solved by an Expert!
Get step-by-step solutions from verified subject matter experts
Step: 2 Unlock
Step: 3 Unlock
Students Have Also Explored These Related Accounting Questions!