

Question: project for my Python class. These are the requirements for the project. I'm asking for guidance on how I should start and present my dataset.
project for my Python class.
These are the requirements for the project. I'm asking for guidance on how I should start and present my dataset.
This is my dataset - https://drive.google.com/file/d/1KUo6DhBPwlFMwE35Iij718tH1pbDGae8/view?usp=drive_link
My dataset is about Airline Passenger Satisfaction on a 1-5 satisfaction scale (with 1-Very Dissatisfied 2-Dissatisfied 3-Neutral 4-Satisfied 5-Very Satisfied)
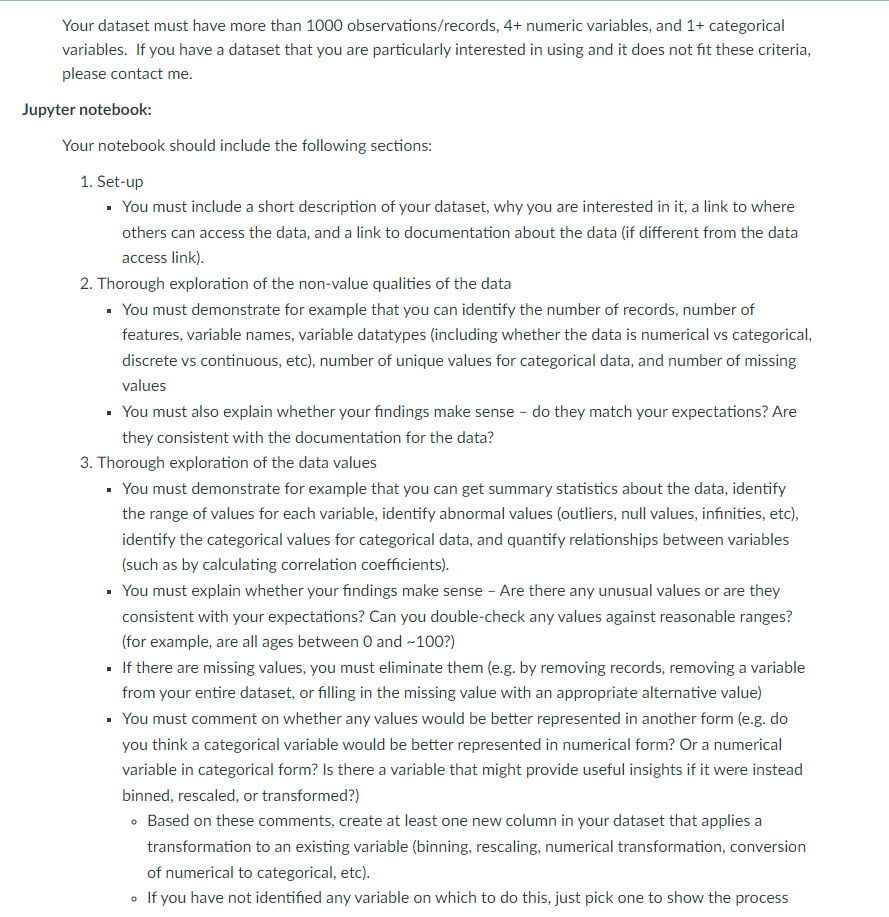
Your dataset must have more than 1000 observations/records, 4+ numeric variables, and 1+ categorical variables. If you have a dataset that you are particularly interested in using and it does not fit these criteria, please contact me. Jupyter notebook: Your notebook should include the following sections: 1. Set-up . You must include a short description of your dataset, why you are interested in it, a link to where others can access the data, and a link to documentation about the data (if different from the data access link). 2. Thorough exploration of the non-value qualities of the data You must demonstrate for example that you can identify the number of records, number of features, variable names, variable datatypes (including whether the data is numerical vs categorical, discrete vs continuous, etc), number of unique values for categorical data, and number of missing values You must also explain whether your findings make sense - do they match your expectations? Are they consistent with the documentation for the data? 3. Thorough exploration of the data values You must demonstrate for example that you can get summary statistics about the data, identify the range of values for each variable, identify abnormal values (outliers, null values, infinities, etc), identify the categorical values for categorical data, and quantify relationships between variables (such as by calculating correlation coefficients). You must explain whether your findings make sense - Are there any unusual values or are they consistent with your expectations? Can you double-check any values against reasonable ranges? (for example, are all ages between 0 and ~100?) If there are missing values, you must eliminate them (e.g. by removing records, removing a variable from your entire dataset, or filling in the missing value with an appropriate alternative value) You must comment on whether any values would be better represented in another form (e.g. do you think a categorical variable would be better represented in numerical form? Or a numerical variable in categorical form? Is there a variable that might provide useful insights if it were instead binned, rescaled, or transformed?) Based on these comments, create at least one new column in your dataset that applies a transformation to an existing variable (binning, rescaling, numerical transformation, conversion of numerical to categorical, etc). O If you have not identified any variable on which to do this, just pick one to show the process
Step by Step Solution
There are 3 Steps involved in it

Get step-by-step solutions from verified subject matter experts