

Question: project number 9 When it comes to payroll, data visualizations can help identify patterns in the data, as well as anomalies. Three different types of
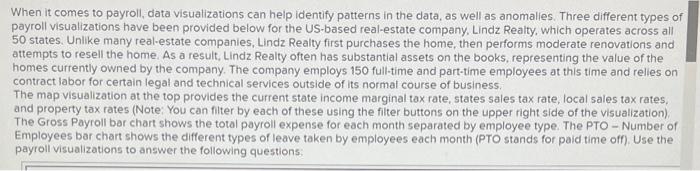
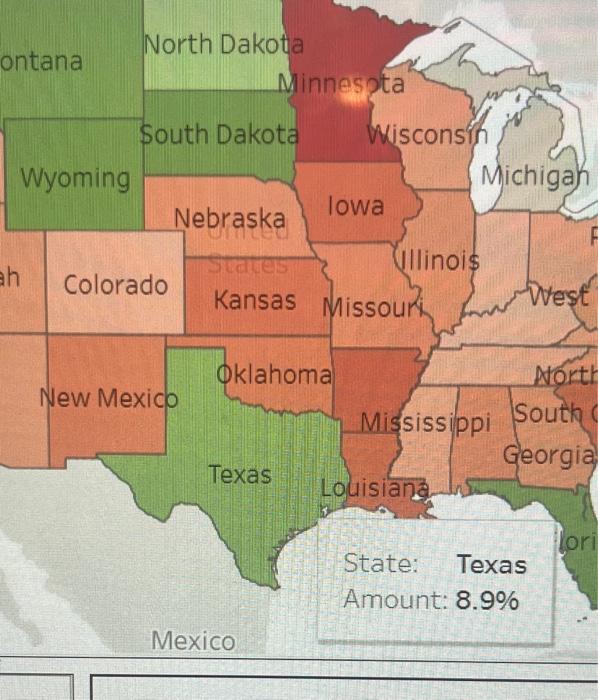
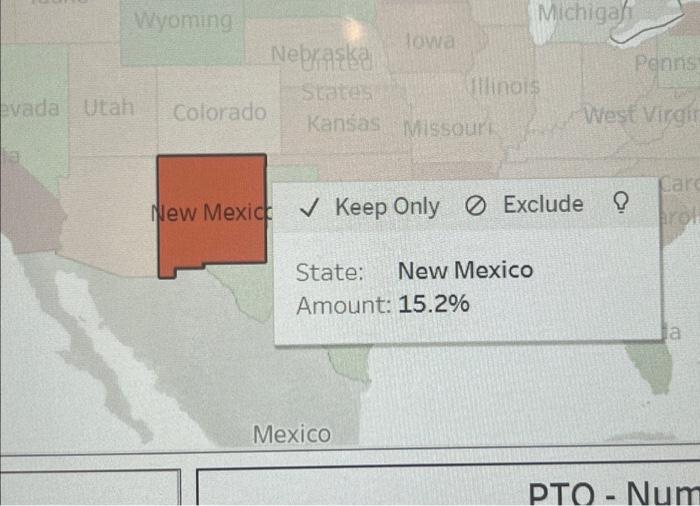
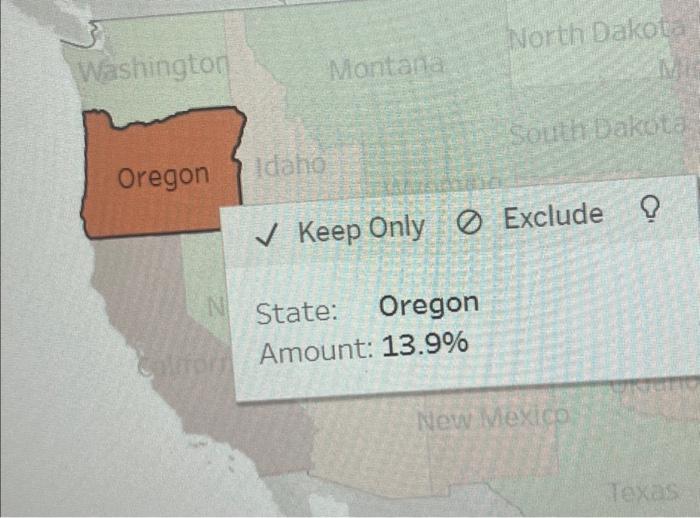
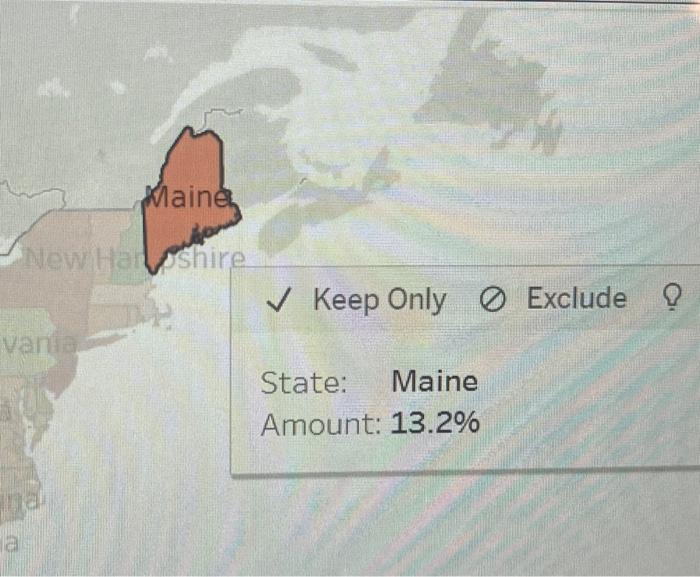
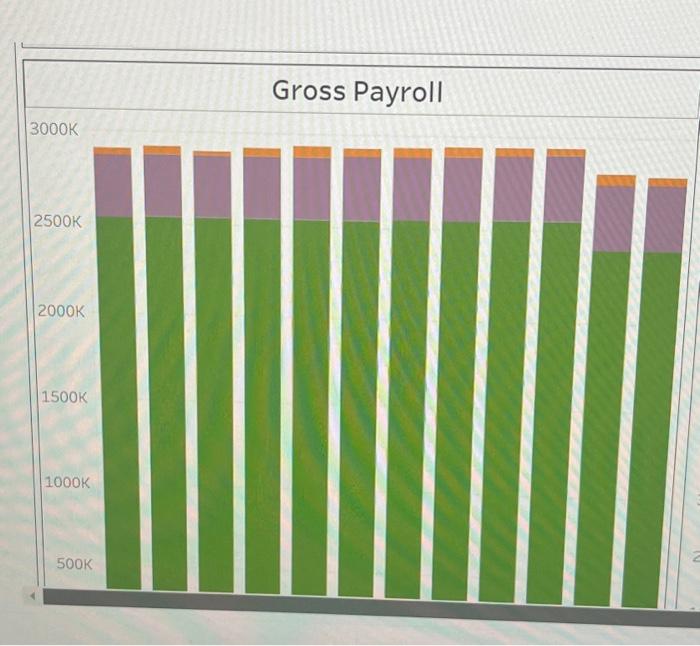
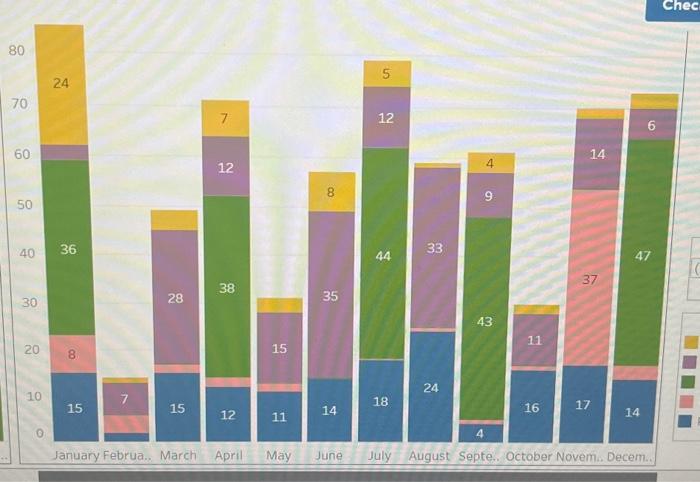
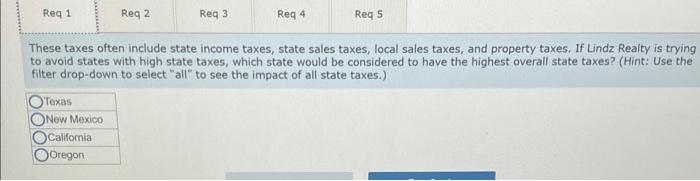
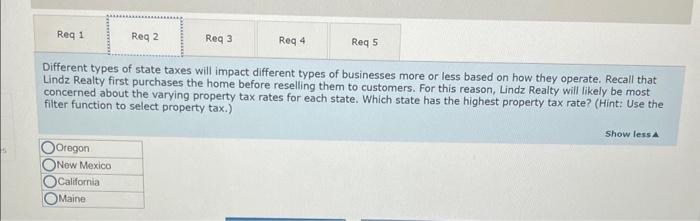
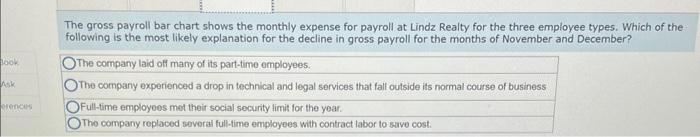
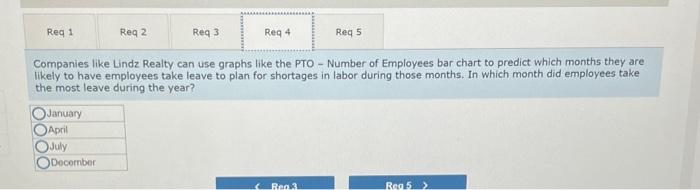
When it comes to payroll, data visualizations can help identify patterns in the data, as well as anomalies. Three different types of payroll visualizations have been provided below for the US-based real-estate company, Lindz Realty, which operates across all 50 states. Unlike many real-estate companies, Lindz Realty first purchases the home, then performs moderate renovations and attempts to resell the home. As a result, Lindz Realty often has substantial assets on the books, representing the value of the homes currently owned by the company. The company employs 150 full-time and part-time employees at this time and relies on contract labor for certain legal and technical services outside of its normal course of business. The map visualization at the top provides the current state income marginal tax rate, states sales tax rate, local sales tax rates, and property tax rates (Note: You can filter by each of these using the filter buttons on the upper right side of the visualization). The Gross Payroll bar chart shows the total payroll expense for each month separated by employee type. The PTO - Number of Employees bar chart shows the different types of leave taken by employees each month (PTO stands for paid time off). Use the payroll visualizations to answer the following questions Oregon Idaho Wyoming Nebraska Nevada Utah Colorado liforni Keep Only Exclude ? State: California Amount: 20.3% State: Oregon Amount: 13.9% State: Maine Amount: 13.2% Gross Payroll 3000K 2500K 2000K 1500K 1000K 500K These taxes often include state income taxes, state sales taxes, local sales taxes, and property taxes. If Lindz Realty is trying to avoid states with high state taxes, which state would be considered to have the highest overall state taxes? (Hint: Use the filter drop-down to select "all" to see the impact of all state taxes.) \begin{tabular}{|l|} \hline Texas \\ \hline New Mexico \\ \hline California \\ \hline Oregon! \\ \hline \end{tabular} Different types of state taxes will impact different types of businesses more or less based on how they operate. Recall that Lindz Realty first purchases the home before reselling them to customers. For this reason, Lindz Realty will likely be most concerned about the varying property tax rates for each state. Which state has the highest property tax rate? (Hint: Use the filter function to select property tax.) Show tess \begin{tabular}{|l|} \hline Oregon \\ \hline New Mexico \\ \hline California \\ \hline \end{tabular} The gross payroll bar chart shows the monthly expense for payroll at Lindz Realty for the three employee types. Which of the following is the most likely explanation for the decline in gross payroll for the months of November and December? The company laid off many of its part-time employees. Companies like Lindz Realty can use graphs like the PTO - Number of Employees bar chart to predict which months they are likely to have employees take leave to plan for shortages in labor during those months. In which month did employees take the most leave during the year? \begin{tabular}{|l|} \hline January \\ \hline April \\ \hline July \\ \hline Decomber \\ \hline \end{tabular} For prediction purposes, not all types of employee leave are as consistent as others from month to month. For this reason, when trying to make predictions regarding of which months Lindz Realty will be understaffed should not include all leave types. Using the "PTO Filter," select only leave types that should be consistent year over year to get a better prediction of which month Lindz Realty is likely to be understaffed. In which month should Uindz Realty plan to have more employees take leave based on this analysis? \begin{tabular}{|l|} \hline January \\ \hline April \\ \hline August \\ \hline Docombor \\ \hline \end{tabular} When it comes to payroll, data visualizations can help identify patterns in the data, as well as anomalies. Three different types of payroll visualizations have been provided below for the US-based real-estate company, Lindz Realty, which operates across all 50 states. Unlike many real-estate companies, Lindz Realty first purchases the home, then performs moderate renovations and attempts to resell the home. As a result, Lindz Realty often has substantial assets on the books, representing the value of the homes currently owned by the company. The company employs 150 full-time and part-time employees at this time and relies on contract labor for certain legal and technical services outside of its normal course of business. The map visualization at the top provides the current state income marginal tax rate, states sales tax rate, local sales tax rates, and property tax rates (Note: You can filter by each of these using the filter buttons on the upper right side of the visualization). The Gross Payroll bar chart shows the total payroll expense for each month separated by employee type. The PTO - Number of Employees bar chart shows the different types of leave taken by employees each month (PTO stands for paid time off). Use the payroll visualizations to answer the following questions Oregon Idaho Wyoming Nebraska Nevada Utah Colorado liforni Keep Only Exclude ? State: California Amount: 20.3% State: Oregon Amount: 13.9% State: Maine Amount: 13.2% Gross Payroll 3000K 2500K 2000K 1500K 1000K 500K These taxes often include state income taxes, state sales taxes, local sales taxes, and property taxes. If Lindz Realty is trying to avoid states with high state taxes, which state would be considered to have the highest overall state taxes? (Hint: Use the filter drop-down to select "all" to see the impact of all state taxes.) \begin{tabular}{|l|} \hline Texas \\ \hline New Mexico \\ \hline California \\ \hline Oregon! \\ \hline \end{tabular} Different types of state taxes will impact different types of businesses more or less based on how they operate. Recall that Lindz Realty first purchases the home before reselling them to customers. For this reason, Lindz Realty will likely be most concerned about the varying property tax rates for each state. Which state has the highest property tax rate? (Hint: Use the filter function to select property tax.) Show tess \begin{tabular}{|l|} \hline Oregon \\ \hline New Mexico \\ \hline California \\ \hline \end{tabular} The gross payroll bar chart shows the monthly expense for payroll at Lindz Realty for the three employee types. Which of the following is the most likely explanation for the decline in gross payroll for the months of November and December? The company laid off many of its part-time employees. Companies like Lindz Realty can use graphs like the PTO - Number of Employees bar chart to predict which months they are likely to have employees take leave to plan for shortages in labor during those months. In which month did employees take the most leave during the year? \begin{tabular}{|l|} \hline January \\ \hline April \\ \hline July \\ \hline Decomber \\ \hline \end{tabular} For prediction purposes, not all types of employee leave are as consistent as others from month to month. For this reason, when trying to make predictions regarding of which months Lindz Realty will be understaffed should not include all leave types. Using the "PTO Filter," select only leave types that should be consistent year over year to get a better prediction of which month Lindz Realty is likely to be understaffed. In which month should Uindz Realty plan to have more employees take leave based on this analysis? \begin{tabular}{|l|} \hline January \\ \hline April \\ \hline August \\ \hline Docombor \\ \hline \end{tabular}
Step by Step Solution
There are 3 Steps involved in it

Get step-by-step solutions from verified subject matter experts