

Question: Project Quality Management, Second Edition By Kenneth H> Rose, PMP The matrix prepared by the recorder might look something like this: Name Mon Tues Wed
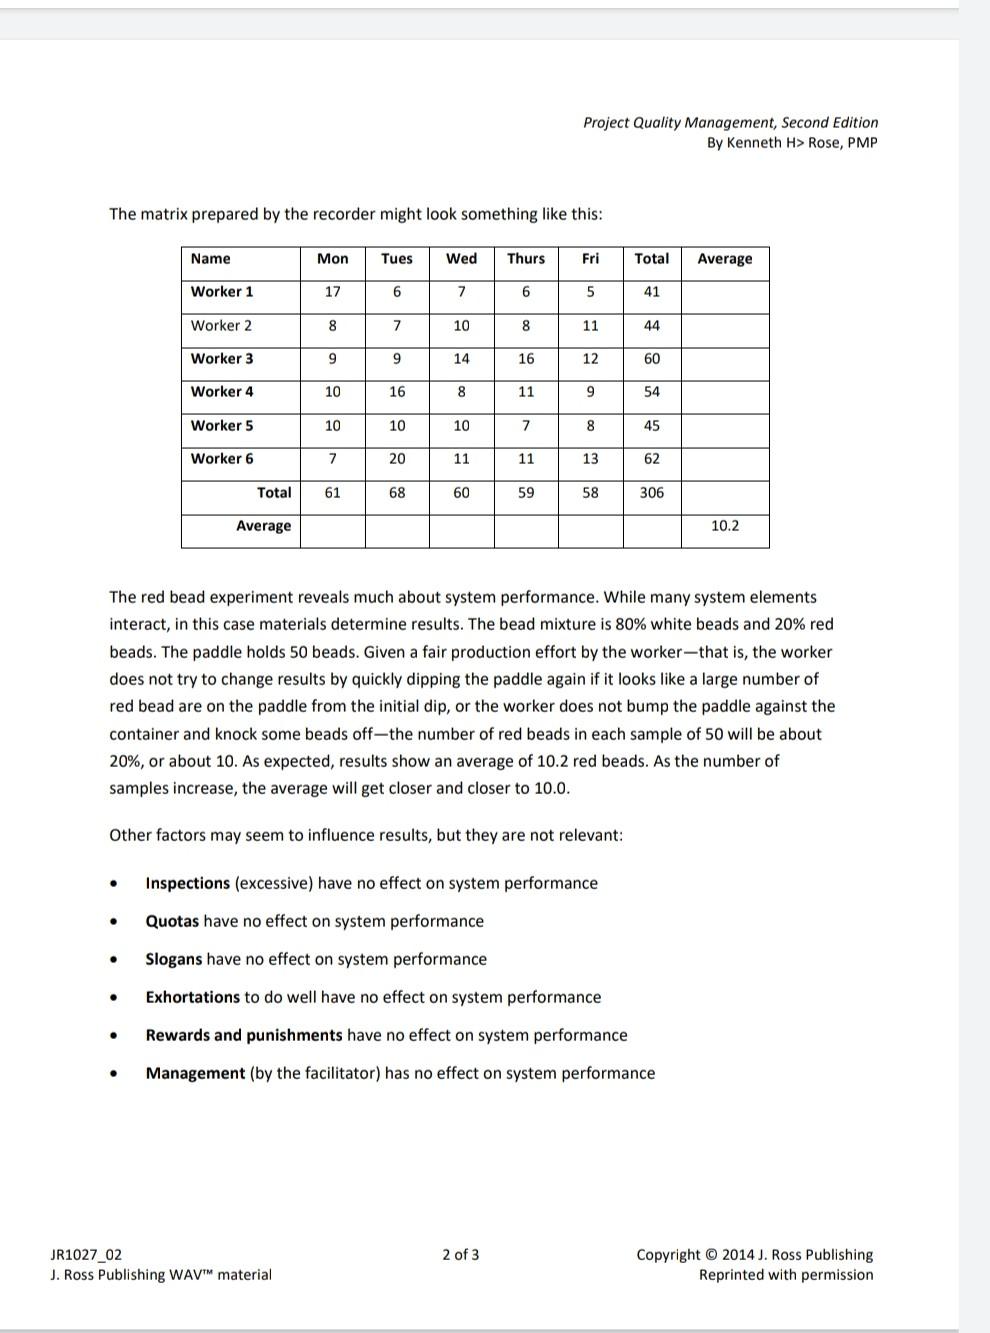

Project Quality Management, Second Edition By Kenneth H> Rose, PMP The matrix prepared by the recorder might look something like this: Name Mon Tues Wed Thurs Fri Total Average Worker 1 17 6 7 6 5 41 Worker 2 8 7 10 8 11 44 Worker 3 9 9 14 16 12 60 Worker 4 10 16 8 11 9 54 Worker 5 10 10 10 7 8 8 45 Worker 6 7 20 11 11 13 62 Total 61 68 60 59 58 306 Average 10.2 The red bead experiment reveals much about system performance. While many system elements interact, in this case materials determine results. The bead mixture is 80% white beads and 20% red beads. The paddle holds 50 beads. Given a fair production effort by the worker-that is, the worker does not try to change results by quickly dipping the paddle again if it looks like a large number of red bead are on the paddle from the initial dip, or the worker does not bump the paddle against the container and knock some beads off-the number of red beads in each sample of 50 will be about 20%, or about 10. As expected, results show an average of 10.2 red beads. As the number of samples increase, the average will get closer and closer to 10.0. Other factors may seem to influence results, but they are not relevant: Inspections (excessive) have no effect on system performance . Quotas have no effect on system performance . Slogans have no effect on system performance Exhortations to do well have no effect on system performance . . Rewards and punishments have no effect on system performance . Management (by the facilitator) has no effect on system performance 2 of 3 JR1027_02 J. Ross Publishing WAV material Copyright 2014 J. Ross Publishing Reprinted with permission Project Quality Management, Second Edition By Kenneth H> Rose, PMP In this case, the only thing that matters-the only factor that affects and determines system performance-is the percentage of red beads in the bead mix. The lesson is: fix the system, don't blame the workers. It calls back to the 85/15 rule that says about 85% of a worker's performances is determined by the system and 15% is determined by individual effort. The bead mixture principally determines results. A worker can still influence results to a degree through careless performance (knocking beads from the paddle during production) or by cheating (dipping the paddle twice), but performance results are mostly a matter of materials, an aspect of the system that is beyond the worker's control. The red bead experiment also reveals something about variation. The data above show an average number of defects of 10.2 per production. But individual production numbers vary from 5 to 20 defects. Each production of 50 beads will not be exactly the same; results will vary. How much results may be expected to vary can be determined by using a control chart and calculating upper and lower control limits. For these data, the upper and lower control limits are 19 and 2, respectively. Normal system performance will yield 2 to 19 defects in any individual production. Workers should not be criticized or specially rewarded for performance within this range. Quotas should not be established outside this range. Slogans and exhortations should not address any performance outside this range. What about Worker 6 who produced 20 defects on Tuesday? How should management respond? Punish the worker? Recall that control limits do not encompass 100% of the data. Control limits are sometimes established at 30 above and below the mean, which encompasses 99.73 % of the data. The performance of 20 defects could be normal system performance that falls within the other 0.23%, or, if these data relate to performance that occurred after the control limits were established, the 20 defects could be a result of special cause variation acting on the system. Perhaps Worker 6 was a new hire that joined the work line after the initial workers completed training and, therefore, received no training. An untrained worker is a source of special cause variation. Using a control chart to analyze the data obtained during the red bead experiment shows that the system is stable and is producing predictable results. The red bead experiment is often an eye- opening experience for participants. It shows more clearly than any text can describe how systems influence results. 3 of 3 JR1027_02 J. Ross Publishing WAV material Copyright 2014 J. Ross Publishing Reprinted with permission Read the attached file carefully and explain: 1. What were the important facts about this experiment? 2. How would you manage the performance of the work and the outcome in an organization? 3. Do you agree with this those employees are only 15% responsible for the defects? Why? Write your explanations in at least 250 words
Step by Step Solution
There are 3 Steps involved in it
1 Expert Approved Answer
Step: 1 Unlock

Question Has Been Solved by an Expert!
Get step-by-step solutions from verified subject matter experts
Step: 2 Unlock
Step: 3 Unlock