

Question: Project Two: Hypothesis Testing . You are a data analyst for a basketball team and have access to a large set of historical data that
Project Two: Hypothesis Testing
.
You are a data analyst for a basketball team and have access to a large set of historical data that you can use to analyze performance patterns. The coach of the team and your management have requested that you perform several hypothesis tests to statistically validate claims about your team's performance. This analysis will provide evidence for these claims and help make key decisions to improve the performance of the team. You will use the Python programming language to perform the statistical analyses and then prepare the report of your findings for the team's management. Since the managers are not data analysts, you will need to interpret your findings and describe their practical implications.
There are four important variables in the data set that you will study in Project Two.
VariableWhat does it represent?ptsPoints scored by the team in a gameelo_nA measure of relative skill level of the team in the leagueyear_idYear when the team played the gamesfran_idName of the NBA team
The ELO rating, represented by the variableelo_n, is used as a measure of the relative skill of a team. This measure is inferred based on the final score of a game, the game location, and the outcome of the game relative to the probability of that outcome. The higher the number, the higher the relative skill of a team.
In addition to studying data on your own team, your management has also assigned you a second team so that you can compare its performance with your own team's.
TeamWhat does it representYour TeamThis is the team that has hired you as an analyst. This is the team that you will pick below. See Step 2.Assigned TeamThis is the team that the management has assigned to you to compare against your team. See Step 1.
Reminder: It may be beneficial to review the summary report template for Project Two prior to starting this Python script. That will give you an idea of the questions you will need to answer with the outputs of this script.
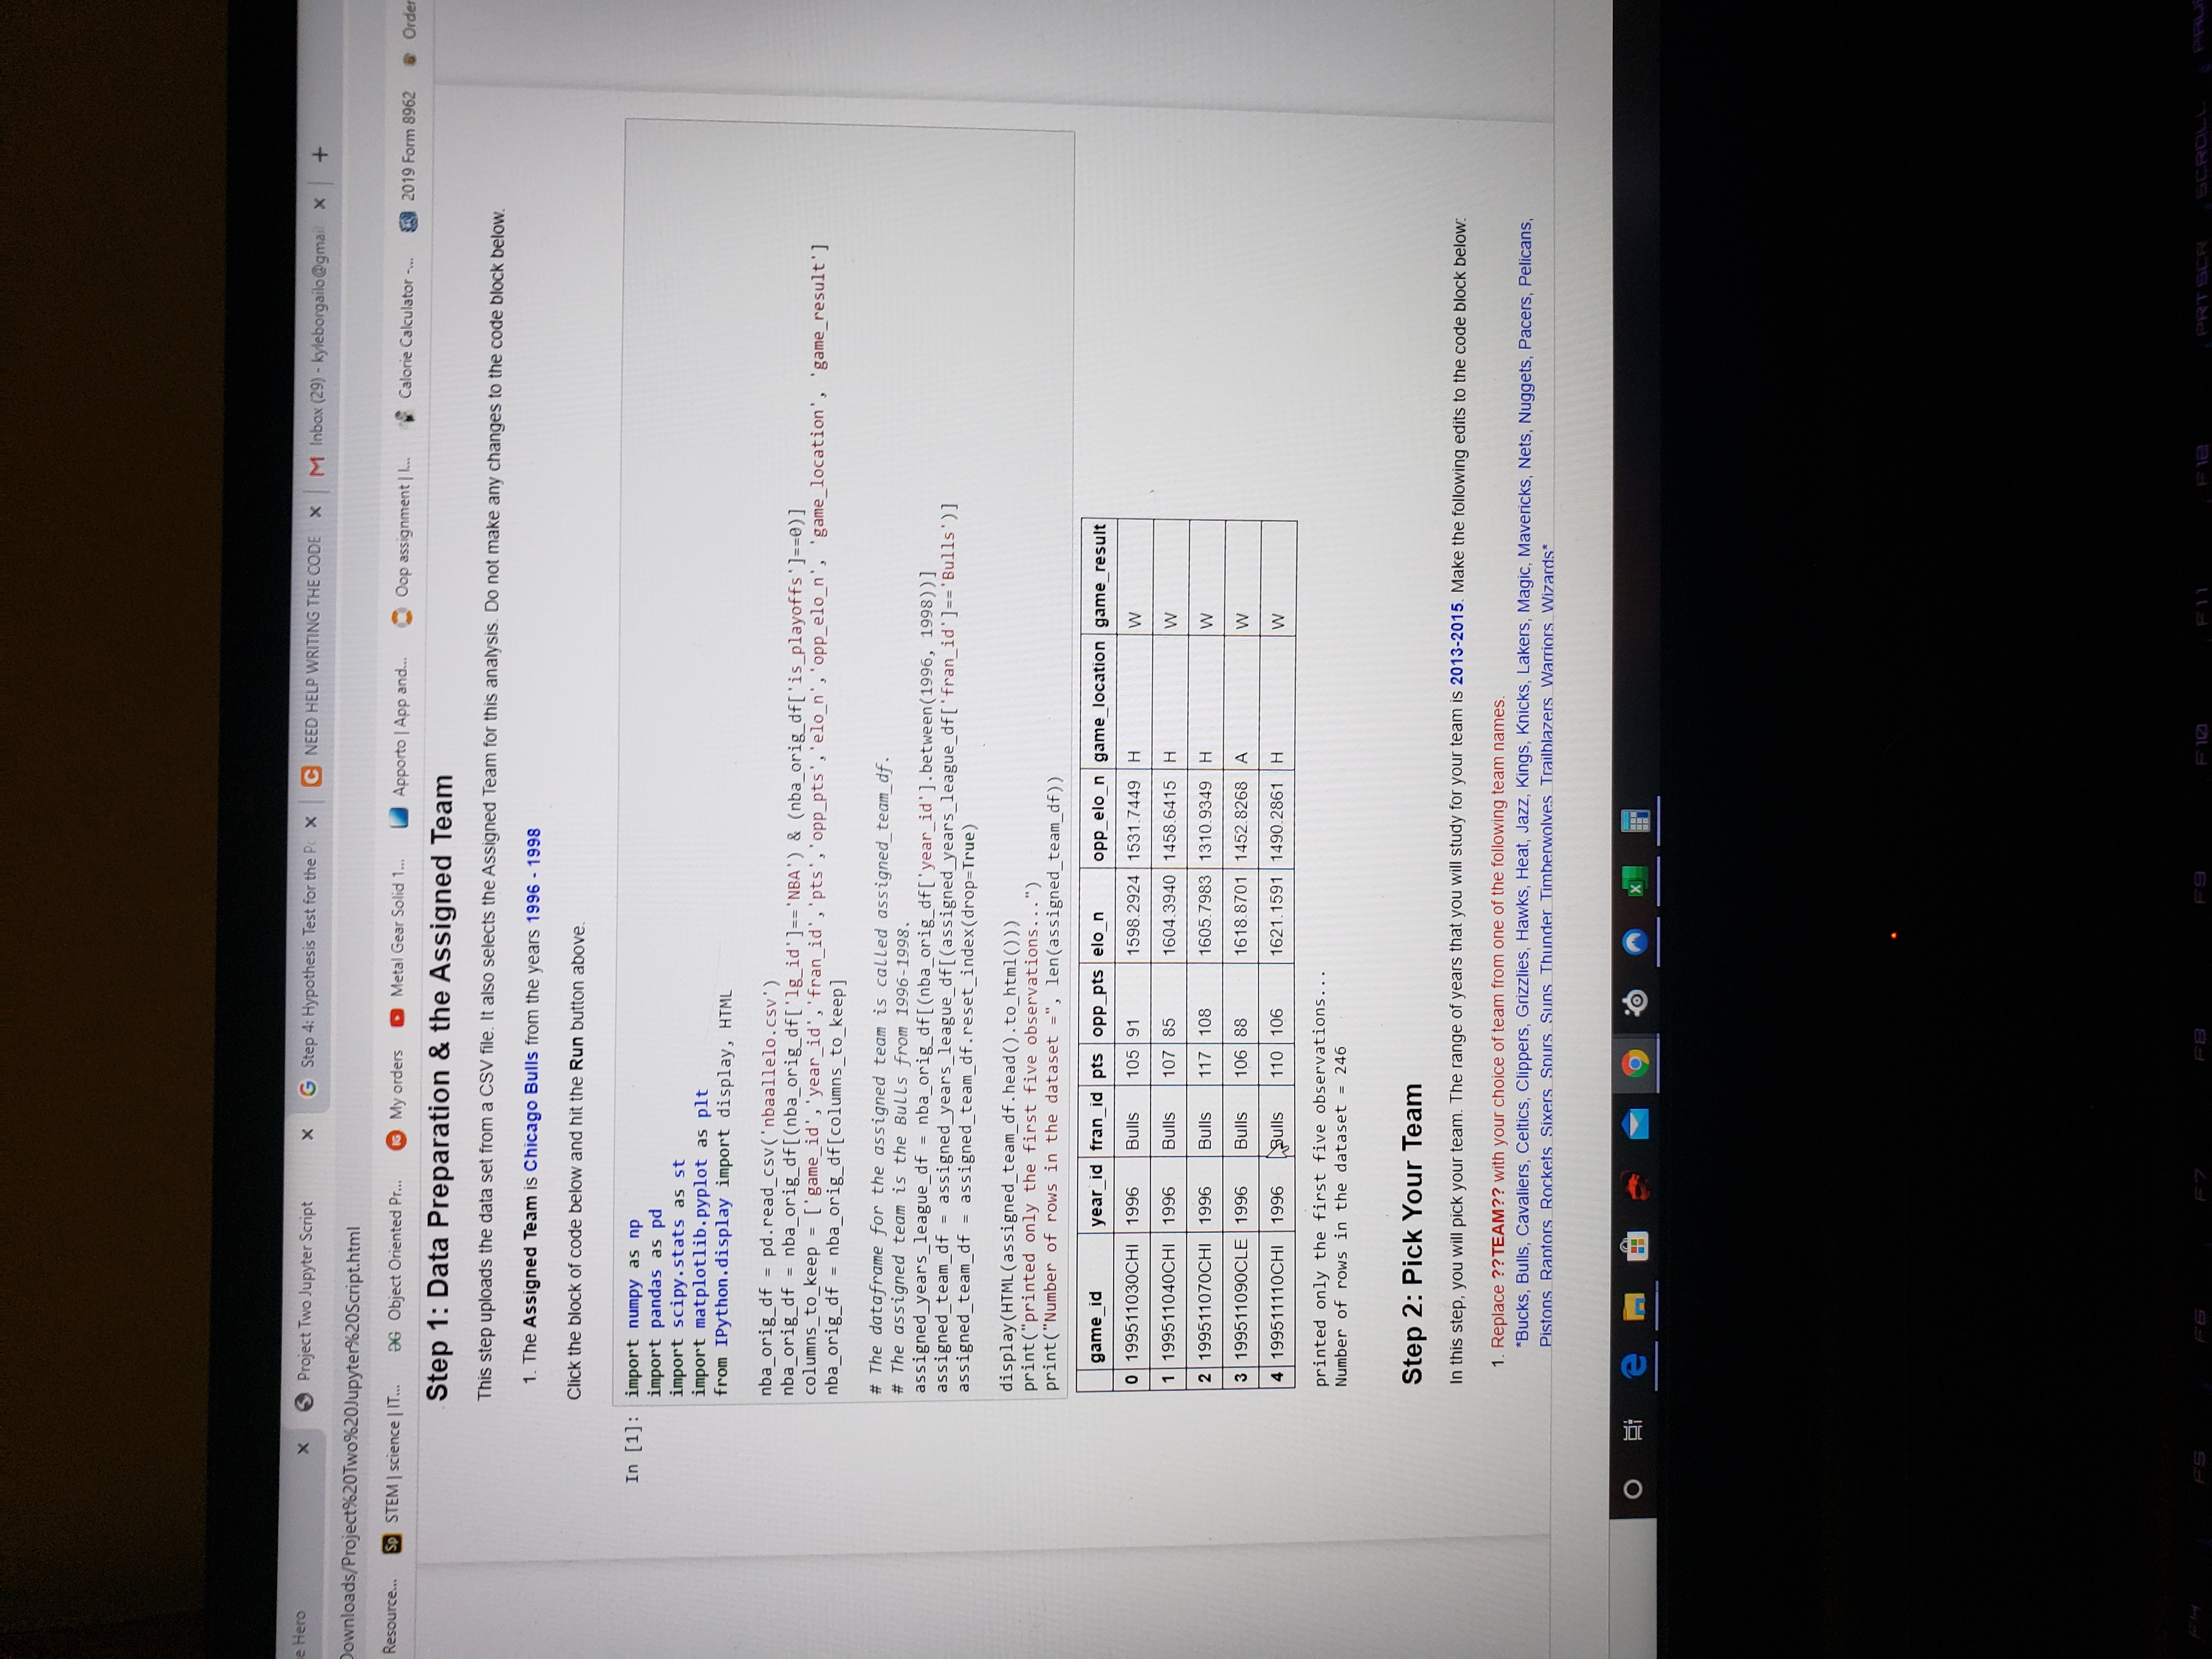
Step 1: Data Preparation & the Assigned Team
This step uploads the data set from a CSV file. It also selects the Assigned Team for this analysis. Do not make any changes to the code block below.
- TheAssigned TeamisChicago Bullsfrom the years1996 - 1998
Click the block of code below and hit theRunbutton above.
In[1]:
import numpy as npimport pandas as pdimport scipy.stats as stimport matplotlib.pyplot as pltfrom IPython.display import display, HTMLnba_orig_df = pd.read_csv('nbaallelo.csv')nba_orig_df = nba_orig_df[(nba_orig_df['lg_id']=='NBA') & (nba_orig_df['is_playoffs']==0)]columns_to_keep = ['game_id','year_id','fran_id','pts','opp_pts','elo_n','opp_elo_n', 'game_location', 'game_result']nba_orig_df = nba_orig_df[columns_to_keep]# The dataframe for the assigned team is called assigned_team_df. # The assigned team is the Bulls from 1996-1998.assigned_years_league_df = nba_orig_df[(nba_orig_df['year_id'].between(1996, 1998))]assigned_team_df = assigned_years_league_df[(assigned_years_league_df['fran_id']=='Bulls')]assigned_team_df = assigned_team_df.reset_index(drop=True)display(HTML(assigned_team_df.head().to_html()))print("printed only the first five observations...")print("Number of rows in the dataset =", len(assigned_team_df))
game_idyear_idfran_idptsopp_ptselo_nopp_elo_ngame_locationgame_result0199511030CHI1996Bulls105911598.29241531.7449HW1199511040CHI1996Bulls107851604.39401458.6415HW2199511070CHI1996Bulls1171081605.79831310.9349HW3199511090CLE1996Bulls106881618.87011452.8268AW4199511110CHI1996Bulls1101061621.15911490.2861HW
printed only the first five observations...Number of rows in the dataset = 246
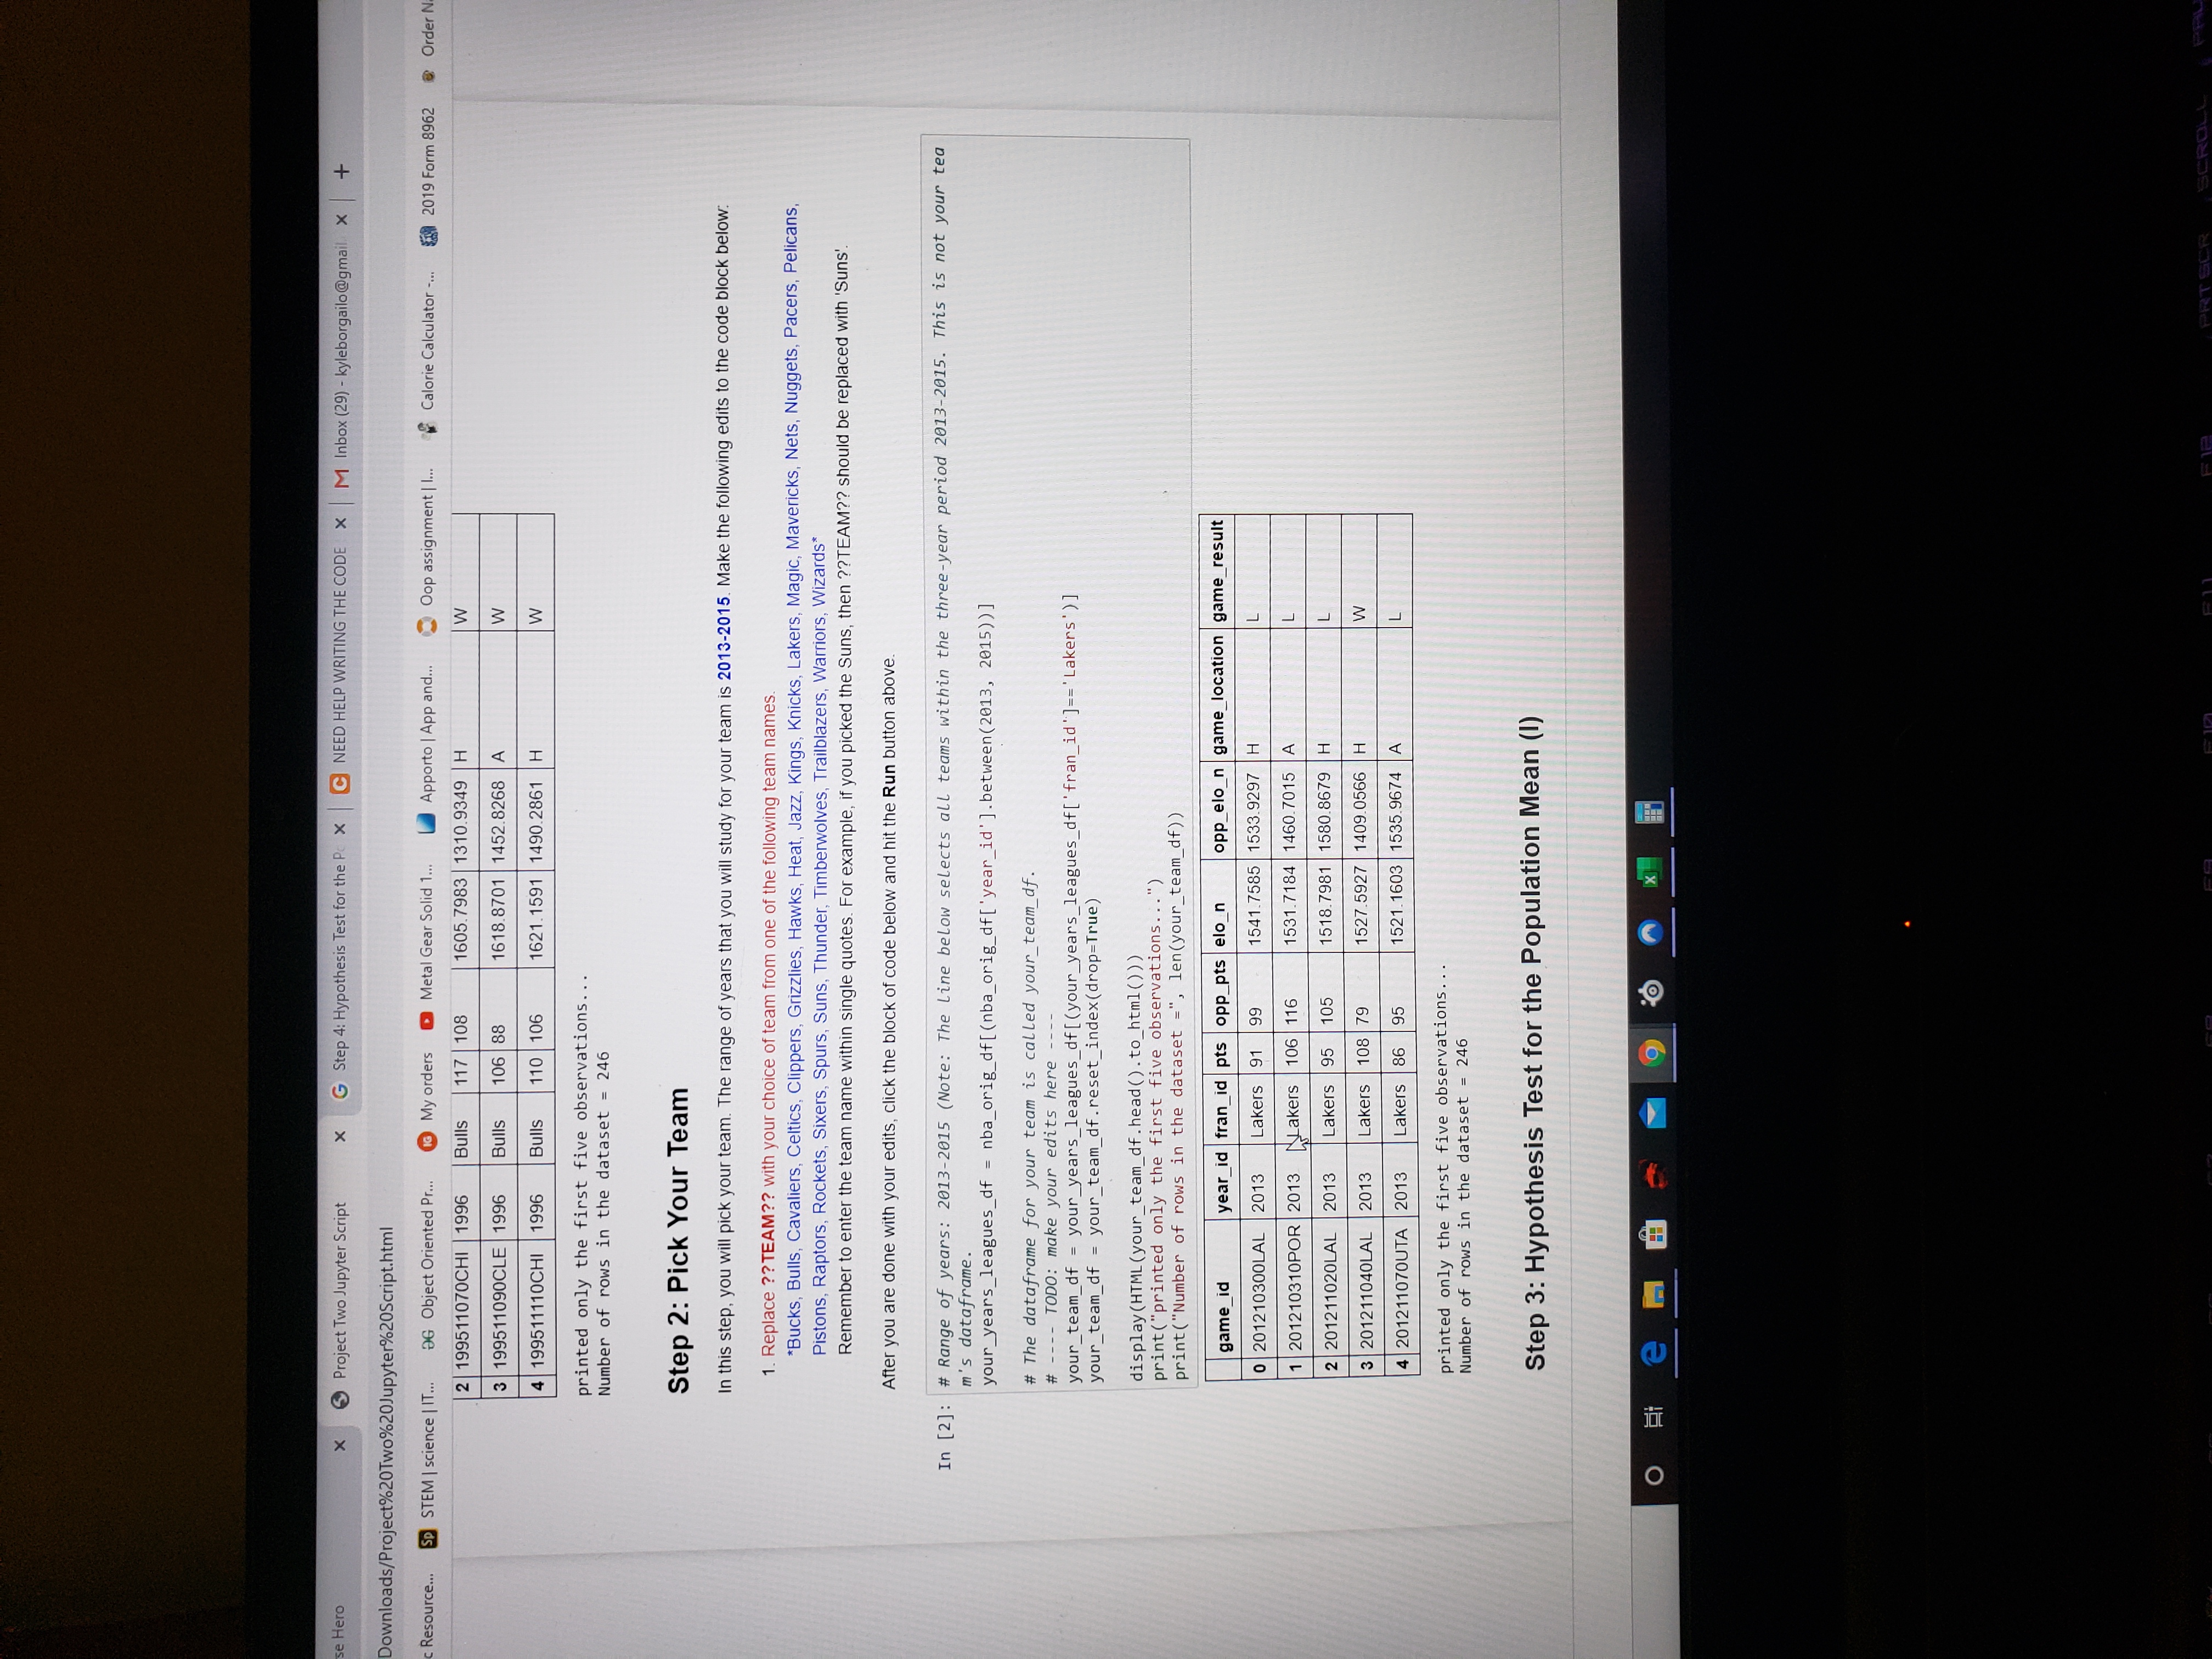
Step 2: Pick Your Team
In this step, you will pick your team. The range of years that you will study for your team is2013-2015. Make the following edits to the code block below:
- ReplacejQuery22407267040550794361_1597097306404TEAMjQuery22404785923012332922_1597098141920with your choice of team from one of the following team names.
- *Bucks, Bulls, Cavaliers, Celtics, Clippers, Grizzlies, Hawks, Heat, Jazz, Kings, Knicks, Lakers, Magic, Mavericks, Nets, Nuggets, Pacers, Pelicans, Pistons, Raptors, Rockets, Sixers, Spurs, Suns, Thunder, Timberwolves, Trailblazers, Warriors, Wizards*
- Remember to enter the team name within single quotes. For example, if you picked the Suns, then jQuery22409294894732639476_1597098258786TEAM?? should be replaced with 'Suns'.
After you are done with your edits, click the block of code below and hit theRunbutton above.
In[2]:
# Range of years: 2013-2015 (Note: The line below selects all teams within the three-year period 2013-2015. This is not your team's dataframe.your_years_leagues_df = nba_orig_df[(nba_orig_df['year_id'].between(2013, 2015))]# The dataframe for your team is called your_team_df.# ---- TODO: make your edits here ----your_team_df = your_years_leagues_df[(your_years_leagues_df['fran_id']=='Lakers')]your_team_df = your_team_df.reset_index(drop=True)display(HTML(your_team_df.head().to_html()))print("printed only the first five observations...")print("Number of rows in the dataset =", len(your_team_df))
game_idyear_idfran_idptsopp_ptselo_nopp_elo_ngame_locationgame_result0201210300LAL2013Lakers91991541.75851533.9297HL1201210310POR2013Lakers1061161531.71841460.7015AL2201211020LAL2013Lakers951051518.79811580.8679HL3201211040LAL2013Lakers108791527.59271409.0566HW4201211070UTA2013Lakers86951521.16031535.9674AL
printed only the first five observations...Number of rows in the dataset = 246
Step 3: Hypothesis Test for the Population Mean (I)
A relative skill level of 1420 represents a critically low skill level in the league. The management of your team has hypothesized that the average relative skill level of your team in the years 2013-2015 is greater than 1420. Test this claim using a 5% level of significance. For this test, assume that the population standard deviation for relative skill level is unknown. Make the following edits to the code block below:
- Replace??DATAFRAME_YOUR_TEAM??with the name of your team's dataframe.See Step 2 for the name of your team's dataframe.
- Replace??RELATIVE_SKILL??with the name of the variable for relative skill.See the table included in the Project Two instructions above to pick the variable name. Enclose this variable in single quotes. For example, if the variable name isvar2then replace ??RELATIVE_SKILL?? with 'var2'.
- Replace??NULL_HYPOTHESIS_VALUE??with the mean value of the relative skill under the null hypothesis.
After you are done with your edits, click the block of code below and hit theRunbutton above.
In[6]:
import scipy.stats as st# Mean relative skill level of your teammean_elo_your_team = your_team_df['elo_n'].mean()print("Mean Relative Skill of your team in the years 2013 to 2015 =", round(mean_elo_your_team,2))# Hypothesis Test# ---- TODO: make your edits here ----test_statistic, p_value = st.ttest_1samp('Lakers DATAFRAME_YOUR_TEAM'['Lakers RELATIVE_SKILL'], 'Lakers NULL_HYPOTHESIS_VALUE')print("Hypothesis Test for the Population Mean")print("Test Statistic =", round(test_statistic,2)) print("P-value =", round(p_value,4)) Mean Relative Skill of your team in the years 2013 to 2015 = 1440.49---------------------------------------------------------------------------TypeError Traceback (most recent call last)-6-75a993106a4f> in module> 8 # Hypothesis Test 9 # ---- TODO: make your edits here -------> 10 test_statistic, p_value = st.ttest_1samp('Lakers DATAFRAME_YOUR_TEAM'['Lakers RELATIVE_SKILL'], 'Lakers NULL_HYPOTHESIS_VALUE') 11 12 print("Hypothesis Test for the Population Mean")TypeError: string indices must be integers
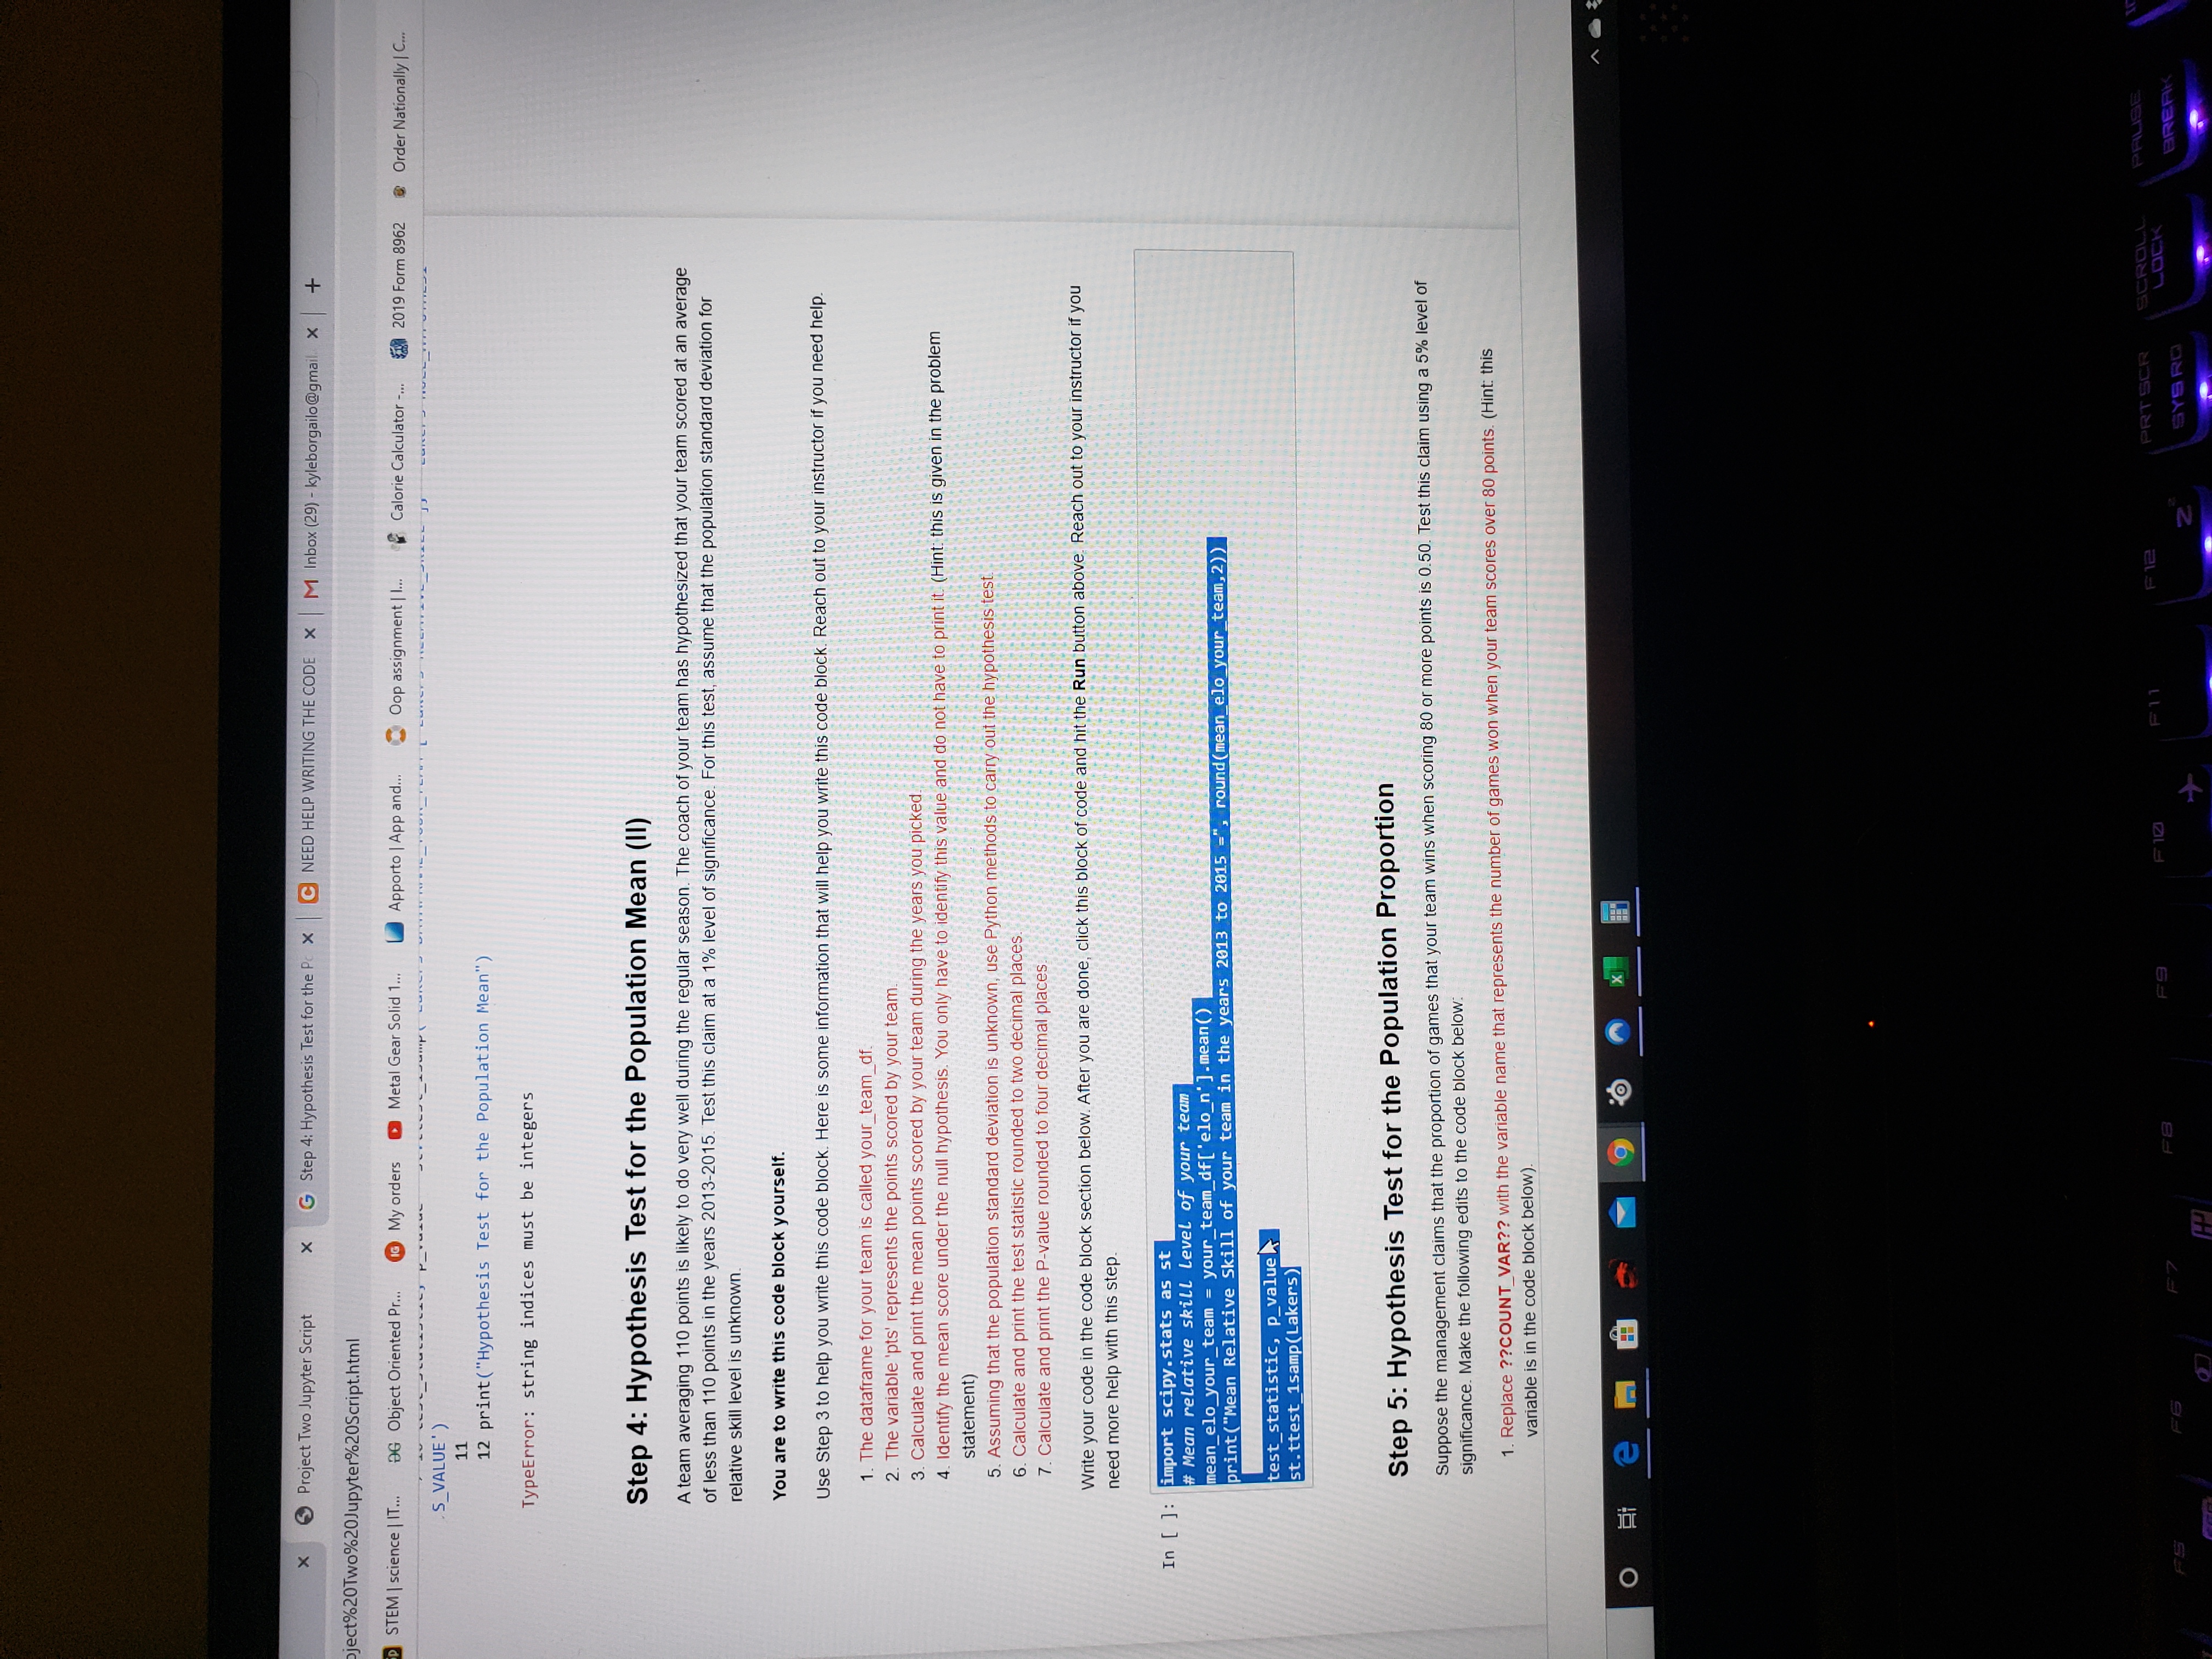
Step 4: Hypothesis Test for the Population Mean (II)
A team averaging 110 points is likely to do very well during the regular season. The coach of your team has hypothesized that your team scored at an average of less than 110 points in the years 2013-2015. Test this claim at a 1% level of significance. For this test, assume that the population standard deviation for relative skill level is unknown.
You are to write code block yourself.
Use Step 3 to help you write code block. Here is some information that will help you write code block. Reach out to your instructor if you need help.
- The dataframe for your team is called your_team_df.
- The variable 'pts' represents the points scored by your team.
- Calculate and print the mean points scored by your team during the years you picked.
- Identify the mean score under the null hypothesis. You only have to identify this value and do not have to print it.(Hint: this is given in the problem statement)
- Assuming that the population standard deviation is unknown, use Python methods to carry out the hypothesis test.
- Calculate and print the test statistic rounded to two decimal places.
- Calculate and print the P-value rounded to four decimal places.
Write the code in the code block section below. After you are done, click this block of code and hit theRunbutton above. Reach out to your instructor if you need more help with this step.
In[]:
Step 4: Hypothesis Test for the Population Mean (II)
A team averaging 110 points is likely to do very well during the regular season. The coach of your team has hypothesized that your team scored at an average of less than 110 points in the years 2013-2015. Test this claim at a 1% level of significance. For this test, assume that the population standard deviation for relative skill level is unknown.
You are to write code block yourself.
Use Step 3 to help you write code block. Here is some information that will help you write code block. Reach out to your instructor if you need help.
- The dataframe for your team is called your_team_df.
- The variable 'pts' represents the points scored by your team.
- Calculate and print the mean points scored by your team during the years you picked.
- Identify the mean score under the null hypothesis. You only have to identify this value and do not have to print it.(Hint: this is given in the problem statement)
- Assuming that the population standard deviation is unknown, use Python methods to carry out the hypothesis test.
- Calculate and print the test statistic rounded to two decimal places.
- Calculate and print the P-value rounded to four decimal places.
Write code in the code block section below. After you are done, click this block of code and hit theRunbutton above. Reach out to your instructor if you need more help with this step.
import scipy.stats as st# Mean relative skill level of your teammean_elo_your_team = your_team_df['elo_n'].mean()print("Mean Relative Skill of your team in the years 2013 to 2015 =", round(mean_elo_your_team,2))test_statistic, p_value =st.ttest_1samp(Lakers)
Step 5: Hypothesis Test for the Population Proportion
Suppose the management claims that the proportion of games that your team wins when scoring 80 or more points is 0.50. Test this claim using a 5% level of significance. Make the following edits to the code block below:
- Replace??COUNT_VAR??with the variable name that represents the number of games won when your team scores over 80 points.(Hint: this variable is in the code block below).
- Replace??NOBS_VAR??with the variable name that represents the total number of games when your team scores over 80 points.(Hint: this variable is in the code block below).
- Replace??NULL_HYPOTHESIS_VALUE??with the proportion under the null hypothesis.
After you are done with your edits, click the block of code below and hit theRunbutton above.
In[]:
from statsmodels.stats.proportion import proportions_ztestyour_team_gt_80_df = your_team_df[(your_team_df['pts'] > 80)]# Number of games won when your team scores over 80 pointscounts = (your_team_gt_80_df['game_result'] == 'W').sum()# Total number of games when your team scores over 80 pointsnobs = len(your_team_gt_80_df['game_result'])p = counts*1.0obsprint("Proportion of games won by your team when scoring more than 80 points in the years 2013 to 2015 =", round(p,4))# Hypothesis Test# ---- TODO: make your edits here ----test_statistic, p_value = proportions_ztest(??COUNT_VAR??, ??NOBS_VAR??, ??NULL_HYPOTHESIS_VALUE??)print("Hypothesis Test for the Population Proportion")print("Test Statistic =", round(test_statistic,2)) print("P-value =", round(p_value,4))
Step 6: Hypothesis Test for the Difference Between Two Population Means
The management of your team wants to compare the team with the assigned team (the Bulls in 1996-1998). They claim that the skill level of your team in 2013-2015 is the same as the skill level of the Bulls in 1996 to 1998. In other words, the mean relative skill level of your team in 2013 to 2015 is the same as the mean relative skill level of the Bulls in 1996-1998. Test this claim using a 1% level of significance. Assume that the population standard deviation is unknown. Make the following edits to the code block below:
- Replace??DATAFRAME_ASSIGNED_TEAM??with the name of assigned team's dataframe.See Step 1 for the name of assigned team's dataframe.
- Replace??DATAFRAME_YOUR_TEAM??with the name of your team's dataframe.See Step 2 for the name of your team's dataframe.
- Replace??RELATIVE_SKILL??with the name of the variable for relative skill.See the table included in Project Two instructions above to pick the variable name. Enclose this variable in single quotes. For example, if the variable name isvar2then replace ??RELATIVE_SKILL?? with 'var2'.
After you are done with your edits, click the block of code below and hit theRunbutton above.
In[]:
import scipy.stats as stmean_elo_n_project_team = assigned_team_df['elo_n'].mean()print("Mean Relative Skill of the assigned team in the years 1996 to 1998 =", round(mean_elo_n_project_team,2))mean_elo_n_your_team = your_team_df['elo_n'].mean()print("Mean Relative Skill of your team in the years 2013 to 2015 =", round(mean_elo_n_your_team,2))# Hypothesis Test# ---- TODO: make your edits here ----test_statistic, p_value = st.ttest_ind(??DATAFRAME_ASSIGNED_TEAM??[??RELATIVE_SKILL??], ??DATAFRAME_YOUR_TEAM??[??RELATIVE_SKILL??])print("Hypothesis Test for the Difference Between Two Population Means")print("Test Statistic =", round(test_statistic,2)) print("P-value =", round(p_value,4))
I need help with steps 4 to the end The attached pictures are all of the steps


Hero x Project Two Jupyter Script * G Step 4: Hypothesis Test for the Pc x C NEED HELP WRITING THE CODE x M Inbox (29) - kyleborgailo@gmail x + ownloads/Project%20Two%20Jupyter%20Script.html Resource... SP STEM | science | IT... DG Object Oriented Pr... 1 My orders Metal Gear Solid 1... Apporto | App and. Oop assignment | I.. Calorie Calculator -.. 2019 Form 8962 Order Nationally | C.. Shop 1 test_statistic, p_value = proportions_ztest (??|COUNT_VAR? ?], ??NOBS_VAR??], ??NULL_HYPOTHESIS_VALUE??) print ("Hypothesis Test for the Population Proportion") print ("Test Statistic =", round(test_statistic, 2)) print ("P-value =", round(p_value, 4)) Step 6: Hypothesis Test for the Difference Between Two Population Means The management of your team wants to compare the team with the assigned team (the Bulls in 1996-1998). They claim that the skill level of your team in 2013- 2015 is the same as the skill level of the Bulls in 1996 to 1998. In other words, the mean relative skill level of your team in 2013 to 2015 is the same as the mean relative skill level of the Bulls in 1996-1998. Test this claim using a 1% level of significance. Assume that the population standard deviation is unknown. Make the following edits to the code block below: 1. Replace ??DATAFRAME_ASSIGNED_TEAM?? with the name of assigned team's dataframe. See Step 1 for the name of assigned team's dataframe . Replace ??DATAFRAME_YOUR_TEAM?? with the name of your team's dataframe See Step 2 for the name of your team's dataframe- 1. Replace ??RELATIVE_SKILL?? with the name of the variable for relative skill. See the table included in Project Two instructions above to pick the variable name. Enclose this variable in single quotes. For example, if the variable name is var2 then replace ??RELATIVE_SKILL?? with "var2' After you are done with your edits, click the block of code below and hit the Run button above. In [ ]: import scipy . stats as st mean_elo_n_project_team = assigned_team_df[ 'elo_n' ] . mean( ) print ("Mean Relative Skill of the assigned team in the years 1996 to 1998 =", round(mean_elo_n_project_team, 2) ) mean_elo_n_your_team = your_team_df [ 'elo_n' ]. mean( ) print ("Mean Relative Skill of your team in the years 2013 to 2015 =", round (mean_elo_n_your_team, 2) ) # Hypothesis Test # ---- TODO: make your edits here -- -- test_statistic, p_value = st. ttest_ind(??DATAFRAME_ASSIGNED_TEAM??|[? ?|RELATIVE_SKILL??]], ??DATAFRAME_YOUR_TEAM? ?) [2?RELATIVE_SKI LL ? ? ]) print ("Hypothesis Test for the Difference Between Two Population Means") print("Test , round(test_statistic, 2)) print ("P-value =", round(p_value, 4) ) End of Project Two Download the HTML output and submit it with your summary report for Project Two. The HTML output can be downloaded by clicking File, then Download as, then HTML. Do not include the Python code within your summary report. TEST F 10 F11 F 12 PRT SCR LOCK PAUSE GERT FG F7 FB 2 SYS RO BREAK P1arse Hero x Project Two Jupyter Script x G Step 4: Hypothesis Test for the Pc x | NEED HELP WRITING THE CODE x M Inbox (29) - kyleborgailo@gmail x |+ Downloads/Project%20Two%%20/upyter%%20Script.html ie Resource... STEM | science | IT... G Object Oriented Pr... My orders Metal Gear Solid 1... Apporto | App and... Oop assignment | I... Calorie Calculator -... ) 2019 Form 8962 @ Order Nation Step 5: Hypothesis Test for the Population Proportion Suppose the management claims that the proportion of games that your team wins when scoring 80 or more points is 0.50. Test this claim using a 5% level of significance. Make the following edits to the code block below 1. Replace ??COUNT_VAR?? with the variable name that represents the number of games won when your team scores over 80 points. (Hint: this variable is in the code block below). 1. Replace ??NOBS_VAR?? with the variable name that represents the total number of games when your team scores over 80 points. (Hint: this variable is in the code block below). 1. Replace ??NULL_HYPOTHESIS_VALUE?? with the proportion under the null hypothesis. After you are done with your edits, click the block of code below and hit the Run button above In [ ]: from statsmodels. stats . proportion import proportions_ztest your_team_gt_80_df = your_team_of [ (your_team_of [ 'pts' ] > 80) ] # Number of games won when your team scores over 80 points counts = (your_team_gt_80_df [ 'game_result' ] == 'W' ). sum() # Total number of games when your team scores over 80 points nobs = len(your_team_gt_80_of [ 'game_result' ]) p = counts*1.0obs print ("Proportion of games won by your team when scoring more than 80 points in the years 2013 to 2015 -", round (p, 4) ) # Hypothesis Test # - - - - TODO: make your edits here - --- test_statistic, p_value = proportions_ztest(??)COUNT_VAR??], ??NOBS_VAR??], ??NULL_HYPOTHESIS_VALUE? ?]) print("Hypothesis Test for the Population Proportion") print("Test Statistic =", round(test_statistic, 2) ) print ("P-value =", round(p_value, 4) ) Step 6: Hypothesis Test for the Difference Between Two Population Means The management of your team wants to compare the team with the assigned team (the Bulls in 1996-1998). They claim that the skill level of your team in 2013- 2015 is the same as the skill level of the Bulls in 1996 to 1998. In other words, the mean relative skill level of your team in 2013 to 2015 is the same as the mean relative skill level of the Bulls in 1996-1998. Test this claim using a 1% level of significance. Assume that the population standard deviation is unknown. Make the following edits to the code block below: 1. Replace ??DATAFRAME_ASSIGNED_TEAM?? with the name of assigned team's dataframe. See Step 1 for the name of assigned team's dataframe. O x FS F7 FB F 10 F12 RT SER LOCK BYBRO BREPx Project Two Jupyter Script x G Step 4: Hypothesis Test for the Pc X C NEED HELP WRITING THE CODE X M Inbox (29) - kyleborgailo@gmail. x + ject%20Two%20Jupyter%20Script.html D STEM | science | IT... DG Object Oriented Pr... IG My orders Metal Gear Solid 1... Apporto | App and... Oop assignment | 1... Calorie Calculator -... 2019 Form 8962 Order Nationally | C... S_VALUE' ) 11 12 print( "Hypothesis Test for the Population Mean") TypeError: string indices must be integers Step 4: Hypothesis Test for the Population Mean (II) A team averaging 110 points is likely to do very well during the regular season. The coach of your team has hypothesized that your team scored at an average relative skill level is unknown. of less than 110 points in the years 2013-2015. Test this claim at a 1% level of significance. For this test, assume that the population standard deviation for You are to write this code block yourself. Use Step 3 to help you write this code block. Here is some information that will help you write this code block. Reach out to your instructor if you need help. 1. The dataframe for your team is called your_team_df. 2. The variable 'pts' represents the points scored by your team. 3. Calculate and print the mean points scored by your team during the years you picked 4. Identify the mean score under the null hypothesis. You only have to identify this value and do not have to print it (Hint: this is given in the problem statement) . Assuming that the population standard deviation is unknown, use Python methods to carry out the hypothesis test 6. Calculate and print the test statistic rounded to two decimal places. 7. Calculate and print the P-value rounded to four decimal places Write your code in the code block section below. After you are done, click this block of code and hit the Run button above. Reach out to your instructor if you need more help with this step. In [ ]: import scipy. stats as st Mean relative skill Level of your team mean_elo_your_team = your_team_df['elo_n' ].mean( ) print ("Mean Relative Skill of your team 2013 to 2015 round (mean elo your team,2)) est_statistic, p_valuek st. ttest_1samp(Lakers) Step 5: Hypothesis Test for the Population Proportion Suppose the management claims that the proportion of games that your team wins when scoring 80 or more points is 0.50. Test this claim using a 5% level of significance. Make the following edits to the code block below: . Replace ??COUNT_VAR?? with the variable name that represents the number of games won when your team scores over 80 points. (Hint: this variable is in the code block below). O e F12 PRT SCR SCROLL PAUSE FS F6 F7 FB FS F10 LOCK 2 SYS RO BREAKHero x Project Two Jupyter Script x G Step 4: Hypothesis Test for the Pc x @ NEED HELP WRITING THE CODE x M Inbox (29) - kyleborgailo@gmail. x + Downloads/Project%20Two%20Jupyter%20Script.html Resource ... SD STEM | science | IT... G Object Oriented Pr... I My orders s Metal Gear Solid 1... Apporto | App and... Oop assignment | |... Calorie Calculator -... 2019 Form 8962 & Or Number UI rows In1 the uataset = 240 Step 3: Hypothesis Test for the Population Mean (1) A relative skill level of 1420 represents a critically low skill level in the league. The management of your team has hypothesized that the average relative skill level of your team in the years 2013-2015 is greater than 1420. Test this claim using a 5% level of significance. For this test, assume that the population standard deviation for relative skill level is unknown. Make the following edits to the code block below 1. Replace ??DATAFRAME_YOUR_TEAM?? with the name of your team's dataframe. See Step 2 for the name of your team's dataframe. 1. Replace ??RELATIVE_SKILL?? with the name of the variable for relative skill. See the table included in the Project Two instructions above to pick the variable name. Enclose this variable in single quotes. For example, if the variable name is var2 then replace ??RELATIVE_SKILL?? with 'var2'. 1. Replace ??NULL_HYPOTHESIS_VALUE?? with the mean value of the relative skill under the null hypothesis. After you are done with your edits, click the block of code below and hit the Run button above. In [6]: import scipy . stats as st # Mean relative skill level of your team mean_elo_your_team = your_team_df ['elo_n' ]. mean( ) print ("Mean Relative Skill of your team in the years 2013 to 2015 =", round(mean_elo_your_team, 2) ) # Hypothesis Test ---- TODO: make your edits here test_statistic, p_value = st. ttest_1samp(' Lakers DATAFRAME_YOUR_TEAM' [ ' Lakers RELATIVE_SKILL' ], ' Lakers NULL_HYPOTHESIS_VALUE. ) print("Hypothesis Test for the Population Mean") print("Test Statistic =", round(test_statistic, 2) ) print ("P-value =", round(p_value, 4) ) Mean Relative Skill of your team in the years 2013 to 2015 = 1440.49 TypeError Traceback (most recent call last)
Step by Step Solution
There are 3 Steps involved in it
To assist you with the coding steps from Step 4 through Step 6 for your hypothesis testing analysis I will guide you through each part of the process Lets break it down step by step Step 4 Hypothesis ... View full answer

Get step-by-step solutions from verified subject matter experts